July 2026 Rental Market Recap: The Rental Market Turns a Corner After Four Soft Years
For the first time in more than four years, three of the market's core indicators moved in the same direction at once. Rent growth is climbing, occupancy is increasing, and renters are searching with more urgency. All three are pointed toward a tightening market for the first time since the construction boom began, and that combination is what makes this month different from the last several. This is the beginning of an inflection. By all indicators the market is still decidedly soft, with year-over-year rent growth remaining negative and occupancy still below its long-run average.
Through 2024 and early 2025, individual metrics would tease a turn and then give it back. As recently as our February recap, rents were still falling and vacancy was setting record highs. What changed is that supply pressure has now receded far enough that the market is stabilizing on its own. Demand is the swing factor now, and that is where the tension sits. The corner is turning. How far it turns depends on renter demand, the weakest part of the picture.
The sections that follow trace that tension. They cover:
- Where the national indicators stand.
- Why the recovery is really the work of a few markets.
- The demand forces that will decide whether it holds.
- What it means for pricing and leasing through the rest of the year.
Three National Rental Market Indicators Turning a Corner at Once
Rent Growth Is Climbing, but Still Below Zero
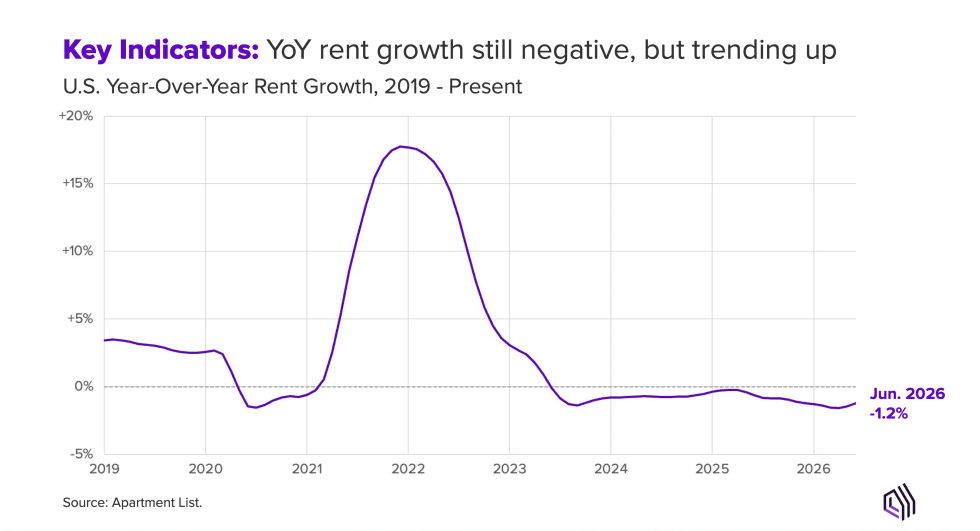
- Month-over-month: rents rose 0.4% in June, the fifth straight monthly increase and double the June 2025 gain. This is the most timely read on where pricing is heading from one month to the next.
- Against 2019: June's increase ran about half of what we saw in the most recent stabilized, pre-pandemic year.
- Year-over-year: now -1.2%, up from a -1.6% bottom a couple of months ago. This measure compares rent to the same month a year earlier, stripping out seasonal swings to show the direction.
That last figure is the first inflection worth watching. Keep it in proportion. A shrinking decline is still a decline. The renewal you send this summer competes against a market that has stopped falling. Pricing power has not come back.
A second milestone sits underneath the trend. The national median rent hit $1,385 in June, essentially matching the $1,388 it would have reached on the steady 2017-to-2019 growth path. The two lines have converged, erasing the entire 2021-2022 run-up of nearly 18%. For your underwriting, the pandemic-era comps are gone, and the realistic baseline is a market that grows slowly rather than one poised to snap back to 2022 rents.
Vacancy Fell for the First Time in Over Four Years
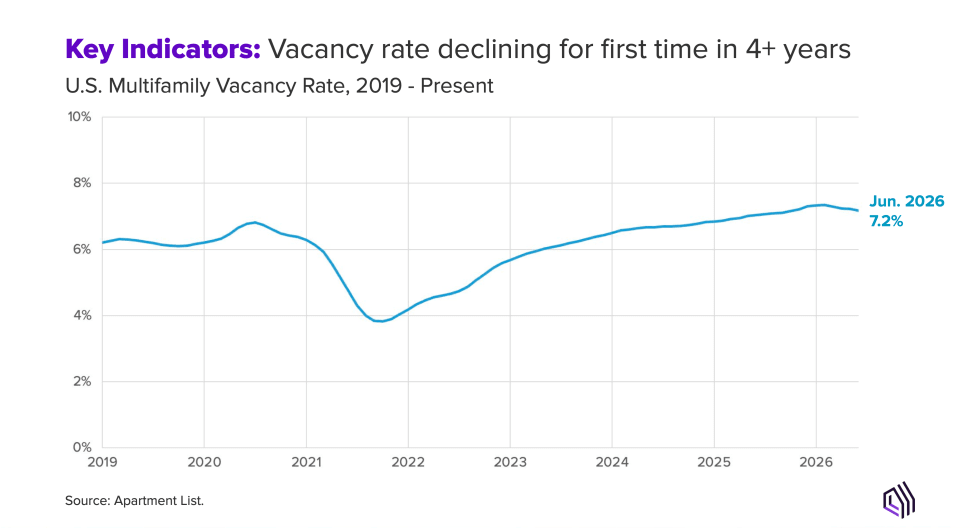
- Current reading: 7.2% among stabilized properties, meaning buildings past their initial lease-up and operating normally. Down from a February peak.
- Why it counts: this is the first downward inflection in the series in over four years. Even in early 2025, when rent growth looked ready to turn positive, vacancy kept climbing.
- The caveat: some of the dip is normal summer tightening, so the direction matters more than the size of the move.
Rent growth and occupancy turning in the same window is arguably the first concrete sign that construction-boom supply pressure is easing. At 7.2% vacancy, occupancy still has to be the priority.
Concessions Are Easing Faster Than the Season Explains
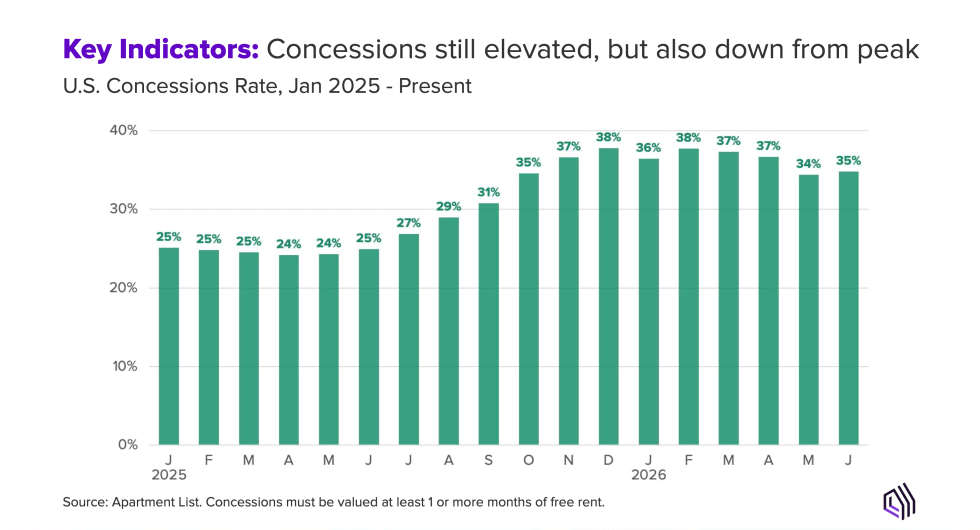
- Current reading: 35% of properties on Apartment List are offering a month of free rent or more.
- Versus a year ago: that share was 25% last June, so roughly ten percentage points more of the market is discounting than at this time last year.
- The move: the rate has fallen since January, and the drop looks sharper than the usual peak-season pullback would produce.
Do not mistake the dip for concessions going away. A third of the properties a prospect compares you against are still dangling a free month. If you are not, your headline rent has to close that gap in the renter's math.
Renter Urgency Turned First, Then Stalled Below Normal
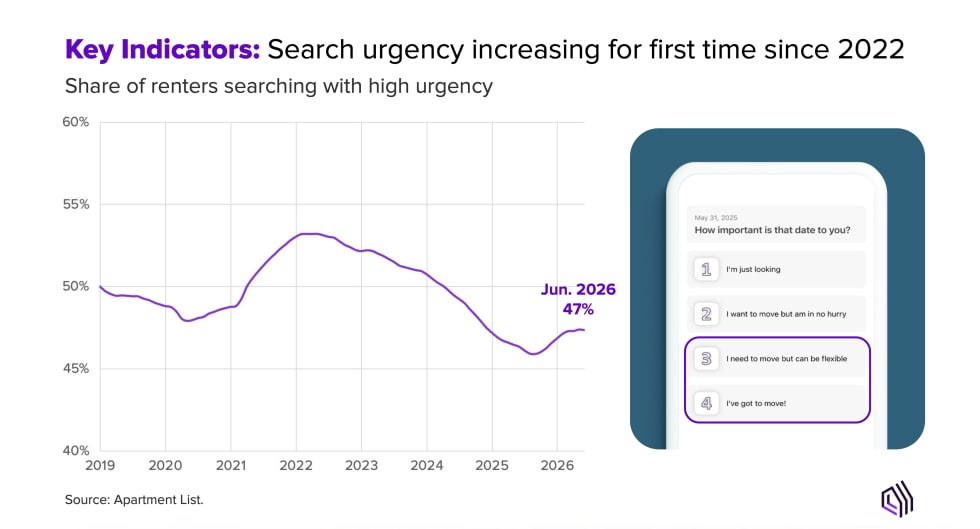
When renters register on Apartment List, we ask how important their move-in date is, from casual browsing to a hard deadline. The high-urgency share is a leading indicator because renters search before they sign, so it shifts before pricing and occupancy do.
- Current reading: 47% of renters searching with high urgency, up from the late-2025 low.
- Timing: this turned before rent growth and vacancy, with those two following a few months later.
- The catch: it has flattened over the past few months, and it plateaued below the long-term average.
Rising urgency means more of your incoming leads are ready to sign rather than window-shopping. A leading indicator that stalls short of normal, though, is a hint the demand rebound could stall too. Capture the ready-to-move renters in front of you now rather than staffing as if the pool keeps growing.
The National Turn Is Really a Handful of Markets
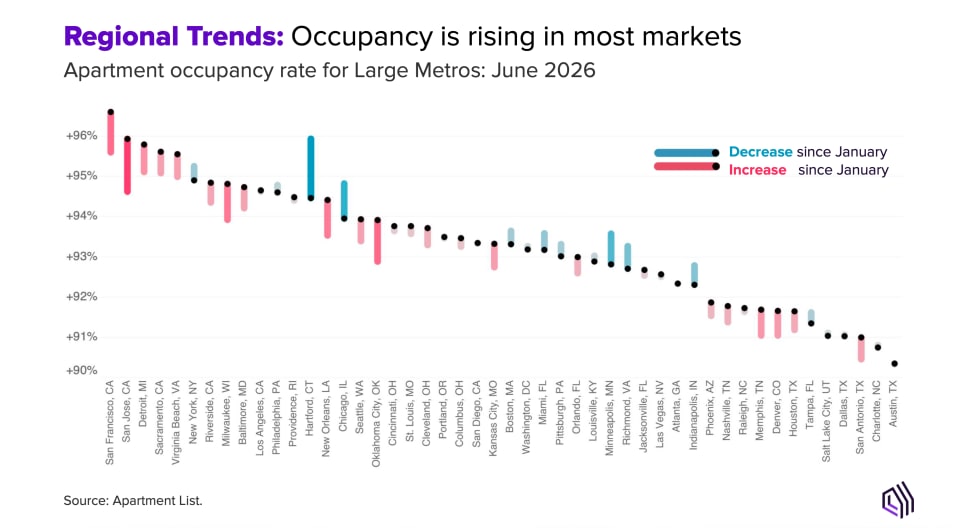
The national numbers hide as much as they reveal. The regional split is the same one that has held for years. Softness stays concentrated in the Sun Belt, where most of the new construction landed. Pricing holds steadier across the Midwest, the Northeast, and parts of the West Coast. What is new is the shape of the extremes. There are genuine boomtowns at the top of the list now, led by San Francisco, while some of the softest Sun Belt markets are showing their first signs of moderating.
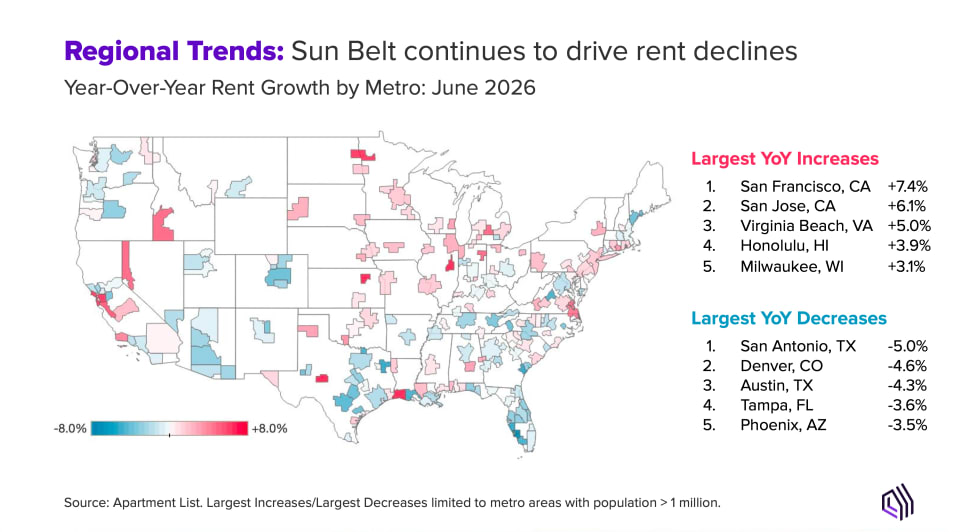
One caveat belongs before the spotlights. The national inflection is not universal, and a good number of metros have actually cooled since January. The turn in the national chart is being driven by a handful of markets shifting hard, rather than a broad, everywhere-at-once recovery.
San Francisco's AI Boom Is a Local Story
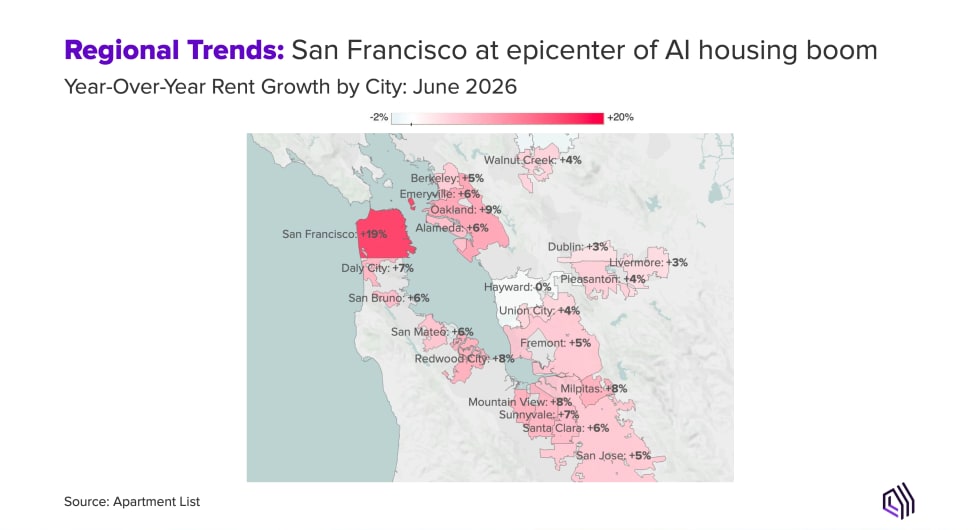
The San Francisco metro is up 7.4% year over year, and the surge in the city itself is even more extreme. Rents in the city of San Francisco have risen 19% over the past year, higher than the 2021-2022 boom this same market spent the following years giving back. The citywide vacancy rate is 2.2%, effectively full occupancy for a major market. Local reports describe prospective tenants offering a full year of rent upfront in cash.
The driver is the labor-market impact of the AI boom, and it is specific to San Francisco in a way that limits what it tells us elsewhere. The largest AI companies occupy massive footprints in the city, they are adding high-paying jobs quickly, and venture capital has flooded in behind them. The effect is regional to a degree. Nearly every city in the San Francisco and San Jose metros has seen meaningful rent increases. The pattern stops at the edge of those two metros.
Even tech employment more broadly looks soft, with notable layoffs at some legacy firms. San Francisco is one of a kind right now. If you operate there, this is a genuine window to push rents. If you operate in another tech-adjacent metro and are hoping for the same lift, the data says do not count on it.
Austin's Thaw Is the Signal to Watch for the Sun Belt
Austin is the more instructive spotlight. It has been the poster child for Sun Belt oversupply, building more new multifamily per capita than any other market by a wide margin. Rent growth there has run negative since 2023, and vacancy climbed toward 10% at its worst. The median rent has fallen more than 20% from its peak, erasing most of the early-pandemic run-up.
The recent shift is what makes Austin worth watching. Year-over-year rent growth is still deeply negative at -4.3%, but the decline has moderated meaningfully from a bottom near -7.6% last year. Occupancy has plateaued and looks like it could be the next indicator to turn. The likeliest driver is on the supply side. Austin issued fewer than half as many apartment permits in 2025 as it did at its 2022 peak. As that pipeline empties and standing supply gets absorbed, the pressure on rents should keep easing.
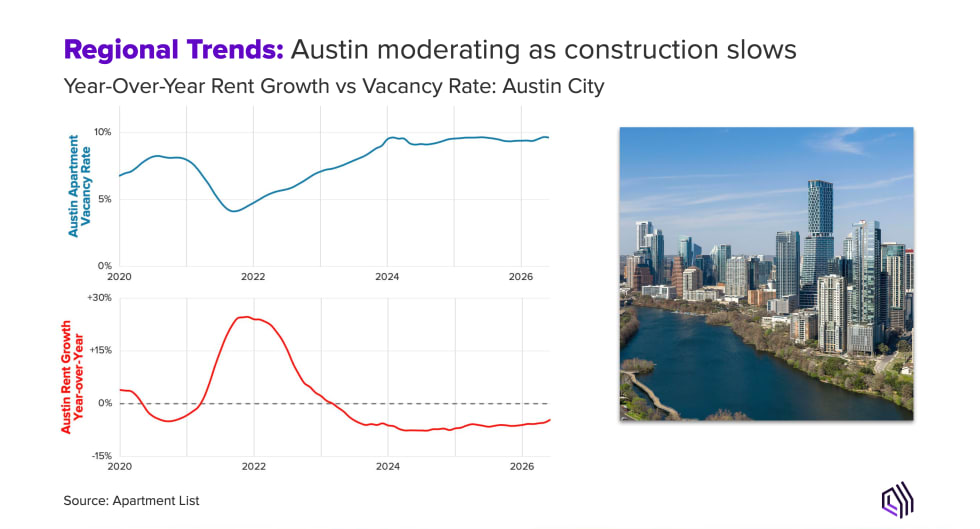
Austin's dynamic looks like the one starting to play out across the Sun Belt, the markets that drove the national slowdown in the first place. Most have not seen the big rent-growth inflection yet, but many are showing an early inflection in occupancy. San Antonio, Denver, Raleigh, Nashville, and Phoenix have all seen occupancy trend up over the past six months, which suggests the swell of units is beginning to get absorbed. If you hold units in these markets, occupancy is the metric to watch on your own portfolio. It tends to firm up before rents do, and it is usually the earliest point at which you can start easing off concessions.
Why the Rebound Now Depends Entirely on Demand
The supply side of the market is nearly settled, which means the open question now is demand, and demand is what will decide how far this rebound goes.
Supply Pressure Is Fading Toward Pre-Pandemic Levels
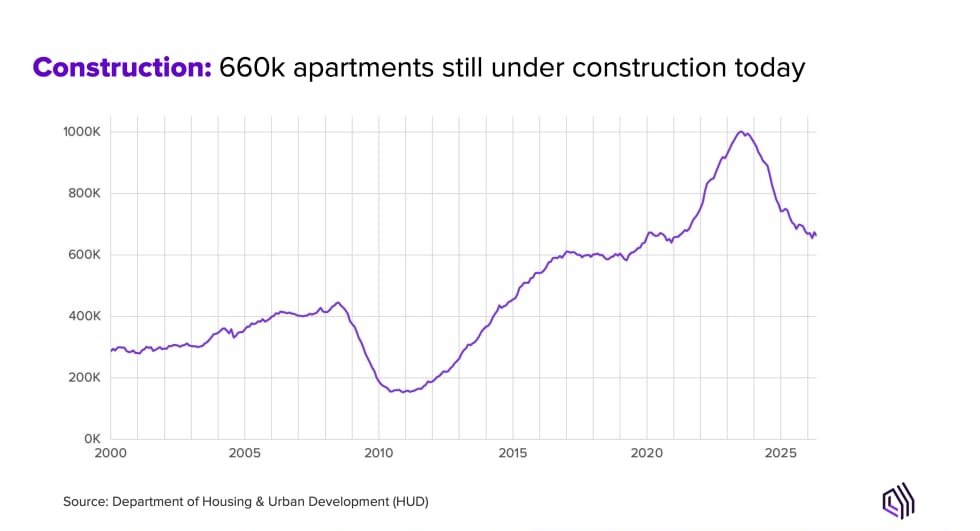
- Under construction: roughly 660,000 apartments, down steadily from the peak. Our team expects it to level out near 600,000 rather than keep falling.
- Permitting: slowed sharply through 2023 and 2024, then flattened at a rate close to the pre-pandemic average.
- The read: developers still see apartments as a sound long-term bet, so new supply is unlikely to dry up to a trickle. The wave that flooded the market, though, is at its tail end.
For operators, supply is becoming the predictable part of the forecast. The relief is real but gradual, so the units competing with yours this year are still elevated, just no longer growing.
A Low-Hire, Low-Fire Job Market Isn't Generating Moves
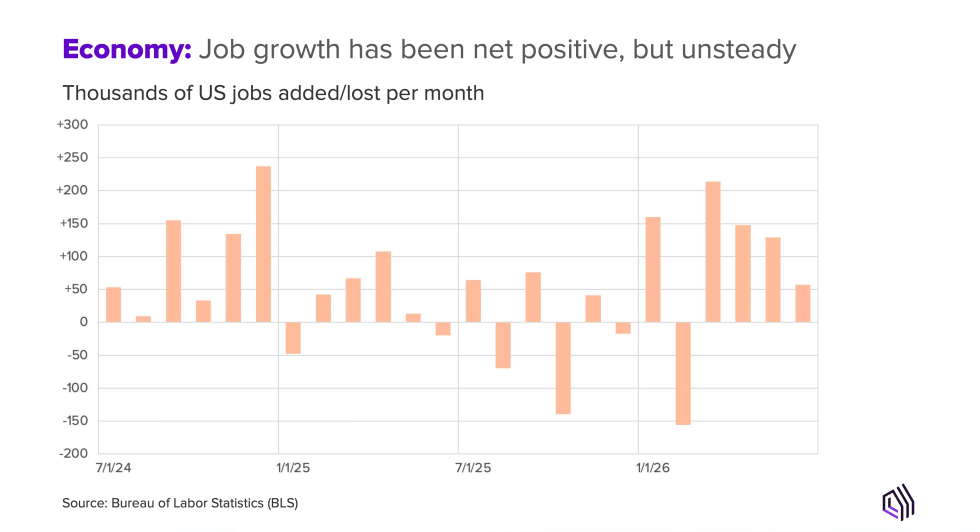
Job creation is a significant driver of housing demand, and right now it is a mixed bag. Hiring was weak through much of 2025, rebounded somewhat this year, and still posted soft months along the way. Core measures like the unemployment rate remain fairly healthy, but the market is not booming. The fit phrase is low hire, low fire: employers and employees alike are in wait-and-see mode.
Weak Sentiment and Renewed Inflation Are Slowing Renter Decisions
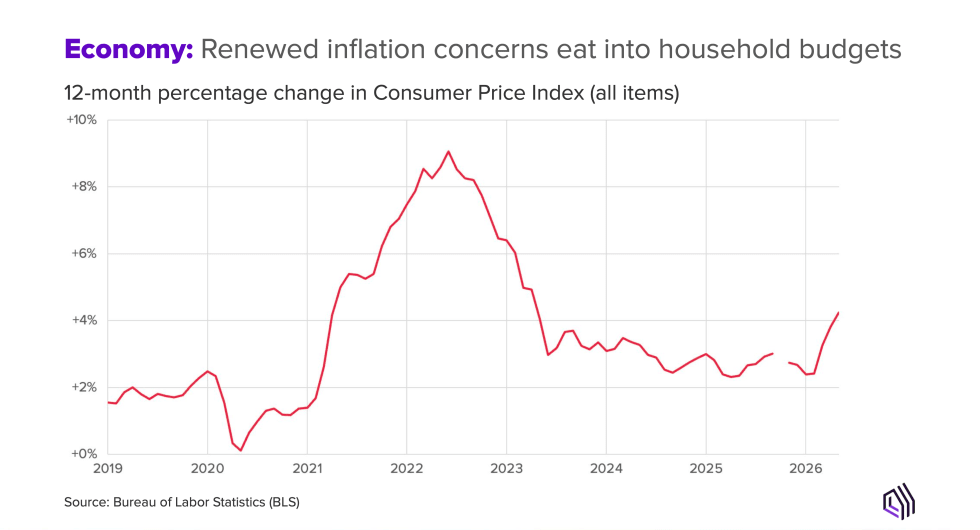
People feel pessimistic even where the aggregate data looks fine. Consumer sentiment is near an all-time low, and it tracks closely with household spending. When people feel uneasy about their finances, they make fewer of the moves that generate rental demand, and renewed inflation this year has only tightened budgets further. Even with rents softer than two years ago, affordability remains stretched, which keeps renters cautious. For your prospects, this shows up as longer decision cycles and more price sensitivity at the tour. The renter who might have signed on the spot two years ago is now sleeping on it and checking three other properties first.
Household Formation, the Renter Pipeline, Keeps Shrinking
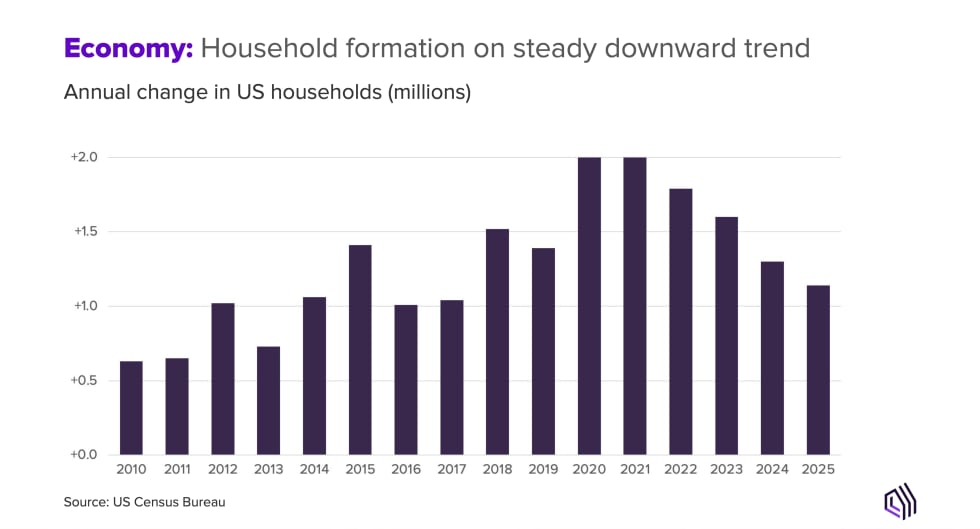
The demand measure that matters most is household formation. It counts the net number of new households created each year as people move out on their own, pair up, or split into separate residences. It has declined steadily since the 2021-2022 peak, and in 2025 it hit its lowest level since 2017.
The figure supports two readings at once. It is coming down off an unusually strong stretch, so it has held up rather than collapsed, but it is well short of robust. Between the labor market, sentiment, and inflation, there is reason to expect formation stays sluggish, which is exactly what would keep this rebound soft. When household formation slows, you are competing harder for a smaller pool of movers, which is why holding your existing residents at renewal matters more this year than chasing new lease-ups.
What Operators Should Do While the Market Is Uncertain
- Price to your submarket. The national number is -1.2%. Your market could be San Francisco at +7.4% or San Antonio at -5.0%. Set your rate off what comparable nearby properties charge, how fast they fill, and what they offer in concessions.
- Protect occupancy before reaching for rent. At 7.2% vacancy, an empty unit is expensive and gets harder to fill the longer it sits. A moderate discount that lands a good resident usually beats eating another month of vacancy. The occupancy turn is early, so wait for it to hold before pushing rents.
- Act on the urgency signal now. Urgency turned before pricing and occupancy did, so operators who respond now sit ahead of those waiting for rent data to confirm it. Urgency has also plateaued below normal, so capture the demand that is present and plan on it staying flat.
- Use concessions deliberately. A free month is a real line item. Reserve it to close a specific deal or hold position in a soft submarket. In slow markets, making renters feel informed and confident often closes more leases than the deepest discount does.
- Watch demand. Supply is the more predictable variable now. What will actually move your 2026 is on the demand side: local job growth, household formation, and whether renter urgency climbs again or stalls. Tracking those tends to surface a shift before it reaches the rent index.
A Fragile Rebound, With Stagnation Still on the Table
The honest read on the year is that the rebound is, in our Chief Economist Chris Salviati's words, "maybe a bit fragile," with a stall into stagnation as plausible as a strong bounce. The condition to carry into the second half follows from that: a market that has stopped deteriorating without yet proving it can grow. Supply did the heavy lifting to get here, and as the construction wave drains, the units competing with yours should stop multiplying. That part of the picture is stable enough to plan around.
The metric to watch next month is occupancy, especially in the Sun Belt. Rent growth tends to move last. Vacancy tightening across markets like San Antonio, Denver, and Phoenix would be the earliest confirmation that the thaw is spreading beyond a few standouts. If occupancy keeps firming while urgency holds, the rebound has a real chance of building. If it flattens again, the likelier path is a long plateau.
What stays genuinely uncertain is demand, and the case for a strong 2026 rebound rests on hope more than evidence until it resolves. The steadiest bet over the next year is the Midwest. Cleveland, Chicago, and Minneapolis have held to slow, steady growth through every recent swing, landing near 2% to 4% rent growth with occupancy in a 6% to 7% sweet spot. That steadiness is the model worth planning toward. A steady, unspectacular year is the safer assumption, and it costs little if the upside arrives.
Watch the full webinar recording. Experience the complete breakdown from Chief Economist Chris Salviati, including all key indicator charts, metro-level data, and live Q&A from multifamily operators across the country.
Stay informed with ongoing market insights. Follow the Apartment List economics team for monthly data releases, market commentary, and the trends shaping renter behavior:
- Research blog: check out monthly market updates and analysis.
- Download the data: rent estimates and underlying datasets.
- Reach out: research@apartmentlist.com with questions, feedback, or to connect with the team.
Share this Article