Re-thinking How We Measure Homeownership

Even with mortgage rates starting to ease, most measures of the U.S. housing market today show unfavorable conditions for prospective homebuyers. The home price-to-income ratio has ascended to an all-time high, and the costs of owning a home are well above the costs of renting one. Interest rates remain elevated compared to what had become the norm in the 2010s and early 2020s, leaving buyers to grapple with rising costs amid a scarcity of affordable options. But despite all this, official housing data suggests something entirely different: that homeownership is in fact rising (quickly), particularly for younger households.
This disconnect – optimistic homeownership data despite pessimistic market indicators – stems from how the homeownership rate is commonly measured. In this report we examine that measurement, consider what it might be missing, and compare it against an alternative rate that shows a more sobering view of the housing market.
Ultimately, homeownership rates alone may paint too rosy of a picture. Increasingly, those who cannot afford to purchase a home are choosing to live with family instead of creating new households. These individuals are not traditional homeowners or renters, but they play a crucial role in helping us understand the health and evolution of the U.S. housing market.
Two Approaches To Calculating Homeownership
The Census Bureau’s official homeownership rate – the one that is commonly cited by those tracking and studying the market – is published in its quarterly Housing Vacancy and Homeownership Survey (HVS). It is calculated by “dividing the number of households that are owners by the total number of occupied households.”1 In other words, it is the share of homes that are owner-occupied as opposed to renter-occupied, and it is represented by the green line in the chart below. Crucially, this considers the ownership status of a housing unit, agnostic to the ownership status of the individuals that occupy the unit. By this definition, the nationwide homeownership rate hit 66 percent in 2023, and is growing at a similar pace to the decade leading up to the housing market crash that precipitated the Great Financial Crisis.
But it is also logical, and perhaps even more natural, to think of homeownership at the individual level – whether or not specific adults have been able to afford purchasing a home and reap the benefits of owning. And while this is not measured directly by the Census Bureau, it can be approximated using the same survey data that feeds into the official homeownership rate. For this report, we have done just that, and the result is represented by the purple line below: the share of adults (25 and older) who are homeowners, defined as the householder, or the spouse of the householder, in an owner-occupied home.2 By this definition, the 2023 homeownership rate is just 60 percent, six percentage points lower than the official rate, and much lower than pre-recession levels.
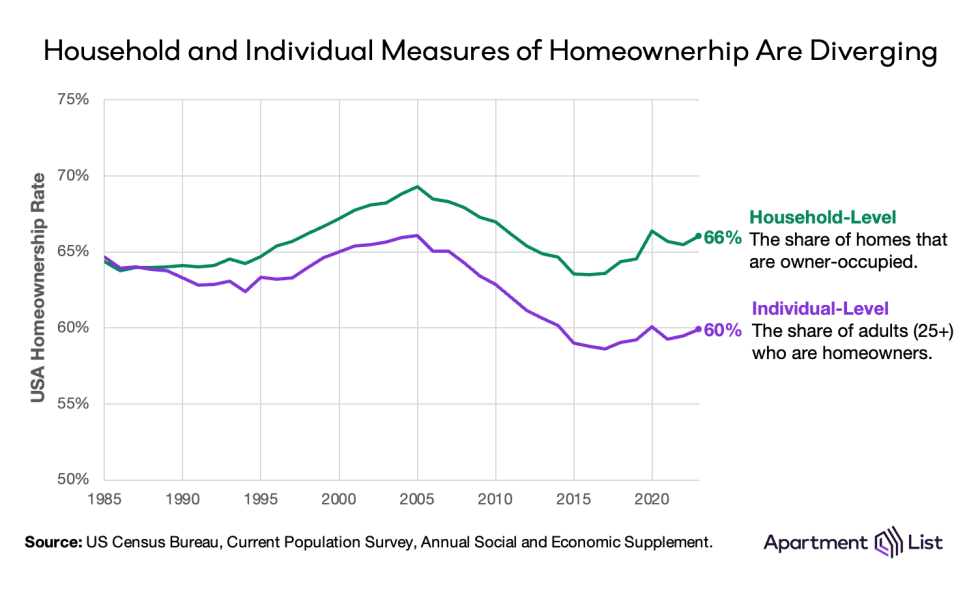
These two homeownership rates lined up through the 1980s, but have since diverged. And today they paint very different pictures about the U.S. housing market. The green household metric says the nationwide homeownership rate fell 5.8 percent during the Great Recession, but is rebounding quickly and today stands several percentage points above pre-bubble levels. The purple individual metric, on the other hand, says homeownership fell 7.4 percent during the crash, and despite trending up slowly in recent years, has not come close to recouping those losses.
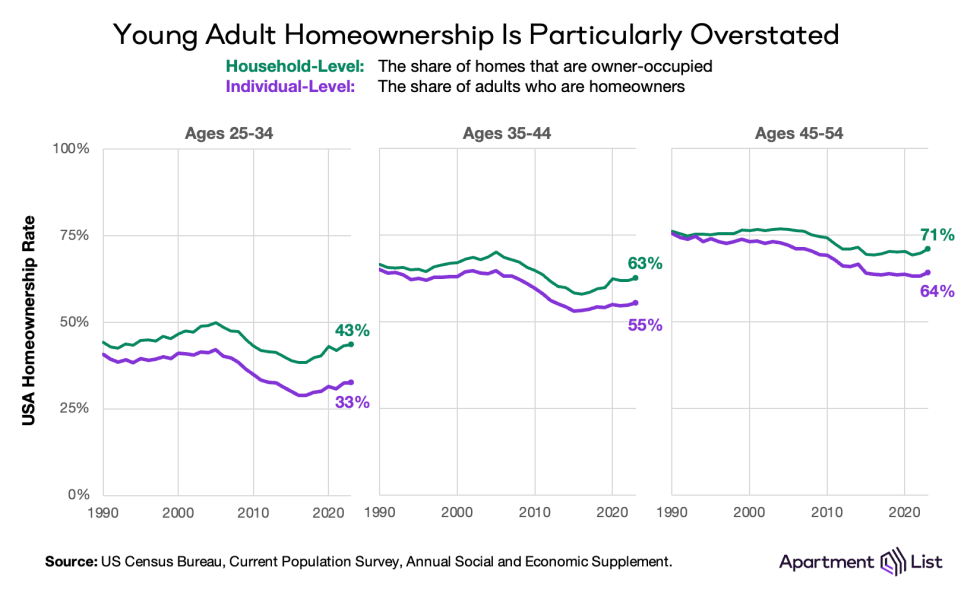
We find this gap across all age groups, but the household-level rate inflates homeownership the most for younger adults. 25-to-34 year olds, who are facing today’s steep financial challenges head-on, have an individual homeownership rate of just 33 percent, a full 10 percentage points lower than the comparable household-level rate.
Why Are These Measures Diverging?
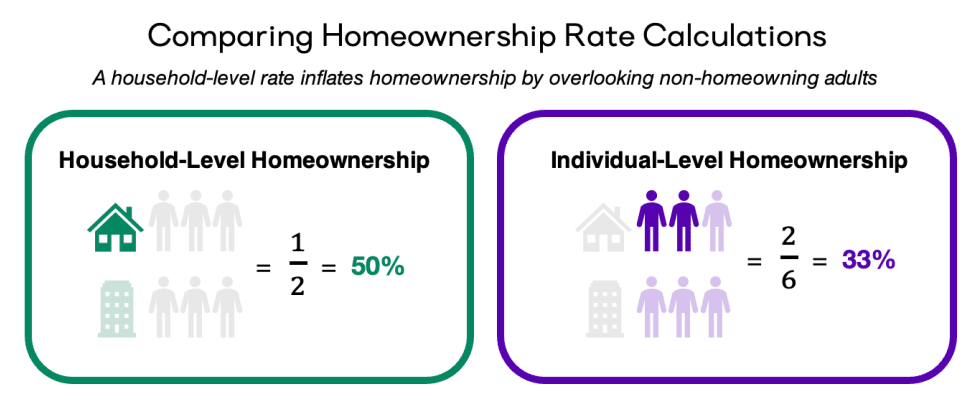
The gap between these two homeownership rates is straightforward to explain. Take for example a married couple who own their home and live with one adult child. The Census Bureau’s household-level rate observes one household and classifies it as a homeowner because it is owner-occupied. But an individual-level rate would consider all three adults separately, classifying two as homeowners (the parents) and one as a non-homeowner (the child).
The composition of renter-occupied homes have a similar effect. If three adult roommates share an apartment, that housing unit counts as just one non-homeowner to the official rate, but would contribute three non-homeowners to the individual rate.
Per the infographic below, a homeownership rate based on individual status will be lower in both of these cases, because it observes more non-homeowning adults in its denominator.
Census data show these housing arrangements are occurring more frequently over time. Whether it be a result of cultural shifts, changes in living preferences, or responses to financial hardship, today more non-homeowners are living together than in previous years, thus inflating the nation’s official homeownership rate.
More Non-Homeowners Are Living Together Today
Summarized below are the living arrangements of adults 25 and older since 1980. The chart shows whether each adult lives in an owner-occupied or renter-occupied home, and whether they own their home themselves. Homeowners are in purple – householders and spouses in owner-occupied homes – which accounts for the 60 percent described earlier. Many of the rest are renters, and a smaller (but growing) share are non-homeowners who live in a home owned by someone else. This group has grown from 8 million adults in 1980 (6 percent of total) to 26 million in 2023 (12 percent of total). The fact that the share of adults who live in owned homes but are not themselves homeowners has doubled over time, is the key driver of the growing wedge between the household-level and individual-level homeownership rates shown above.
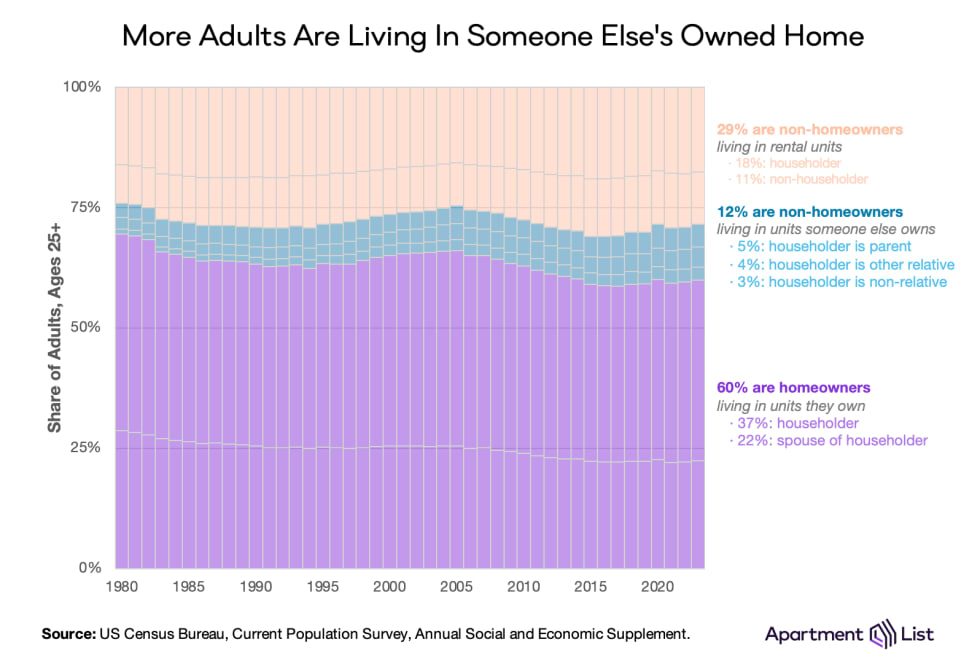
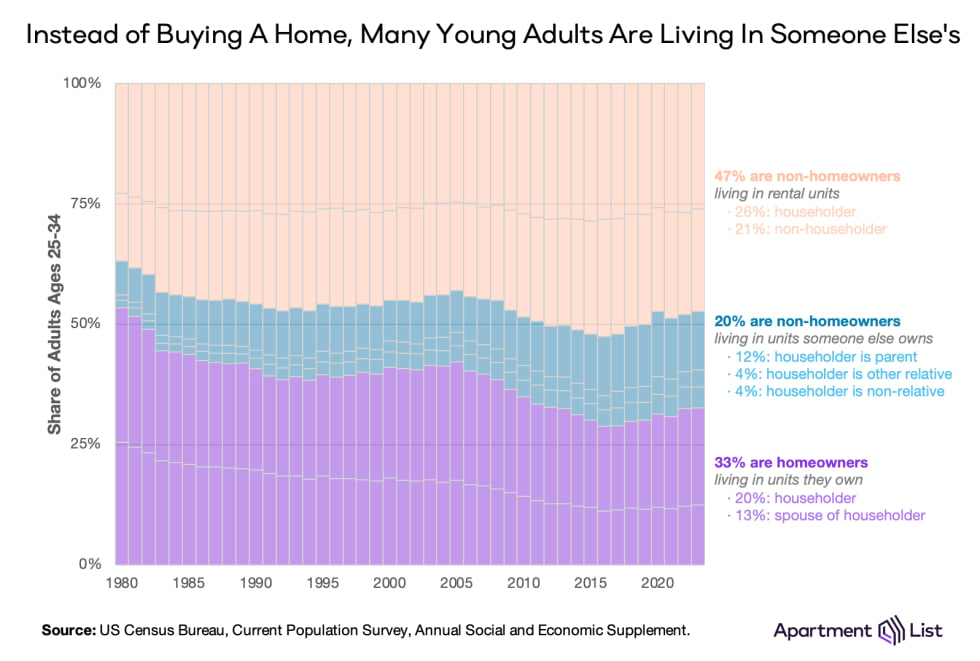
The trend is even stronger if we zoom in on younger adults in their prime first-time homebuying years (below). The non-homeowner categories are larger and growing more quickly, thanks to a handful of interconnected trends:
- People are waiting longer to buy homes. According to the National Association of Realtors, the median age of first-time homebuyers reached 36 in 2022, an all time high.
- Young adults are living with their parents for longer. According to an Apartment List analysis of Census data, the share of 25-35 year olds living in their parents’ home has more than doubled over the past 50 years.
- Student debt is increasingly getting in the way of housing independence and homeownership. According to the Pew Research Center, over 40 percent of adults in their late-20s and early-30s have outstanding student loans, a substantial increase from three decades earlier.
As a result, today 20 percent of young adults between the ages of 25 and 34 (9 million in total) live in a home owned by someone else. 12 percent live at their parents’ home, 4 percent live in another relative’s home, and 4 percent in a home owned by someone unrelated. Combined with the additional 47 percent who rent, this drives down the individual-level young adults homeownership rate to just 33 percent in 2023.
Both Approaches Have Their Merits
The household-level homeownership rate reported by the Census Bureau has the major benefits of simplicity and longevity. It provides a stable measure of the housing market, and in broad terms the economic prosperity of American households, over long periods of time. High homeownership signals wealth creation, financial stability, and upward economic mobility. But with time, we see shifts in household composition affecting the validity of this rate. The data suggest that today, this long-standing measure may be understating the growing barriers to homeownership.
As housing costs surge and ownership lags for younger generations, a homeownership rate built on individual characteristics provides a more nuanced view of the housing market. With affordable homes in short supply, this measure responds appropriately to household consolidation, and better describes who is accumulating the wealth benefits of homeownership. The traditional household-level rate overlooks the fact that many young adults may be wrongfully considered homeowners because they live in homes owned by someone else.
The individual-level homeownership rate presented here is fuzzier, however, as existing census surveys do not ask directly about mortgage holdings. Instead, we infer that information from other variables, including householder relationship variables that evolve over time. This adds a wider margin of error, but in even our most optimistic definitions, the individual homeownership rate falls well short of the official household-level estimate. Millennials are already on pace to own fewer homes than previous generations, and with Gen Z approaching their home buying years in a historically unaffordable market, alternative measures like this one provide a well-rounded perspective on the current and future state of homeownership.
- US Census Bureau, Homeownership & Vacancy Survey, Definitions & Explanations.↩
- According to the US Census Bureau Subject Definitions, the householder is “the person (or one of the people) in whose name the housing unit is owned or rented.”↩
Share this Article

