Rent CPI remains elevated even as rents for new leases dip
While inflation has come down significantly from its peak, it remains stubbornly above the Federal Reserve’s long-term target. A major reason for this is the fact that housing costs as tracked by the CPI – which comprise one-third of the overall index – are still running hot. Ahead of tomorrow’s eagerly anticipated CPI release, we explore why housing inflation has been so slow to cool and what we can expect to see going forward.
Rent CPI is slowing but lags the cooldown shown in the AL rent index
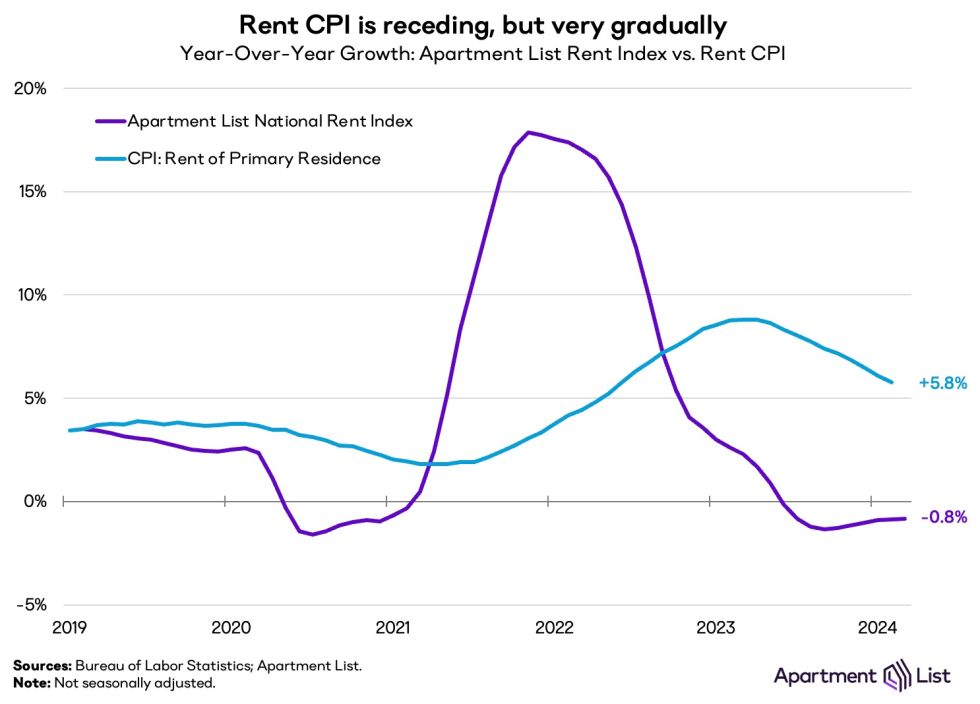
As of the most recent release based on data for February, the rent component of CPI is logging a year-over-year growth rate of 5.8 percent. That rate has been cooling gradually for nearly a year, after peaking at 8.8 percent from February through April of last year. But despite that slowdown, rent CPI remains elevated, especially compared to our Apartment List rent index, which shows that rent prices for new leases are down slightly year-over-year.

The difference between our index and the rent component of CPI reflects the fact that the two indexes are designed to measure different concepts. The Apartment List rent index measures composition-controlled price changes for new leases, while the CPI tracks rent changes across all households. Since only a small share of households sign a new lease in any given month, it takes time for changes in market-rate asking rents to filter through to the entire market.
As a result of these differing methodologies, our index serves as an effective leading indicator for the rent component of CPI. The year-over-year growth rate of our index peaked in November 2021, leading the peak in rent CPI by 16 months. That peak was then followed by a steady decline in our measure of year-over-year rent growth, which lasted for nearly two full years before bottoming out last October. The fact that our index hit its bottom just six months ago implies that it will likely be some time before rent CPI completes its gradual descent.
A similar lagging relationship was demonstrated in a working paper published by economists at the Cleveland Fed last year, in which they used the raw data from the BLS survey that informs CPI to calculate a new index using a methodology similar to the Apartment List rent index. That work led the BLS to begin publishing the new index prototyped in that paper as a supplement to the official measure of housing inflation, exemplifying the way in which the work of private sector data providers can inform and influence work on the official economic indicators estimated by goverment agencies.
Housing costs are keeping overall inflation elevated
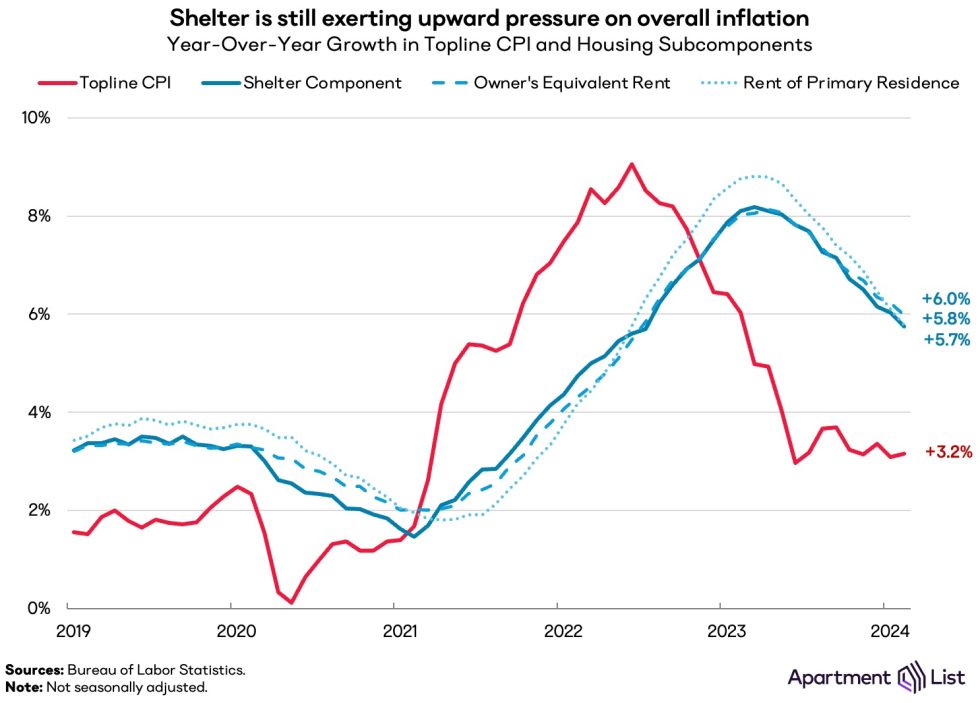
The ongoing cooldown in rent CPI is crucially important, as housing costs are currently the primary factor keeping overall inflation elevated. The “shelter” component of CPI – which includes both renter-occupied and owner-occupied housing costs – is the single largest component of topline CPI, comprising one-third of the overall index. And because costs for owner-occupied housing are measured with the concept of “owner’s equivalent rent,”1 trends in market rents are the key determinant of not just the rent component, but of the shelter component as a whole.

As of February, the shelter component of CPI is up by 5.7 percent year-over-year, tracking closely with its two main subcomponents. For most of 2021 and 2022, the shelter component was logging slower growth than topline CPI, which was being elevated by volatile food and energy prices. But since late 2022 the reverse has been true – shelter is running substantially hotter than topline CPI, and is preventing overall inflation from normalizing more quickly. Excluding the shelter component, the remainder of CPI was up just 1.8 percent year-over-year as of February.
What’s ahead for inflation?
Right now, one question dominates discussions of the economy – when will the Fed decide that the battle against inflation has been won and start lowering interest rates? Fed officials have signaled that they intend to begin cutting rates sometime this year, but stagnating progress on topline inflation and ongoing strength in the labor market have raised questions about that plan.
While most components of inflation are difficult to predict, we can say with confidence that the upward pressure being exerted by the shelter component will continue to gradually ease. The exact timing of that cooldown is somewhat less certain, but it’s worth noting that since beginning to come off its peak, the year-over-year growth rate of shelter CPI has been decelerating at a fairly consistent pace of 0.2 percentage points per month – if that pace continues, it will end 2024 under 3.5 percent. It’s also important to bear in mind that even though the Fed is targeting an overall inflation rate of 2 percent, the shelter component does not necessarily need to come down to that level. From 2018 to 2019, the year-over-year growth rate of shelter CPI ranged from 3.1 percent to 3.5 percent, even as topline CPI hovered around the 2 percent target.
It will still be some time before shelter CPI fully metabolizes the shock to market rents, but that process need not be complete for the Fed to decide that inflation is under control. The Fed understands the relationship between new-lease rents and full-market rents, and is actively tracking the cooldown reflected in real-time private market indicators such as the Apartment List rent index. In other words, the deceleration of housing inflation is already accounted for in the Fed’s forecast, and shelter inflation alone should not be a blocker to the Fed cutting rates.
If you’re interested in speaking further with a member of the Apartment List research team about the latest inflation numbers, please reach out to us at research@apartmentlist.com
- For homeowners, rather than tracking changes in monthly mortgage costs, the BLS methodology estimates how much each owner-occupied housing unit would rent for if it were put on the rental market.↩
Share this Article
