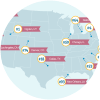
Per Apartment List, 22 of 55 large metros had lower rent than a year earlier (as of September 2026). What a slowing construction wave means for renters.
Updated October 2026. Market snapshot: September 2026. Current market figures come from Apartment List's October 2026 National Rent Report. Historical comparisons use Apartment List data and research.
As the apartment construction wave slows, fewer new openings can reduce competition among properties and eventually put upward pressure on rents. The timing depends on local demand and the apartments still under construction.
The supply wave is the burst of new buildings that followed the 2021–2022 rent surge: in each of the past two years, developers finished more new apartments than in any year from 1988 through 2022. In many metro areas, renters found more apartments to choose from, listings that stayed up longer, and move-in offers. In 22 of the country's 55 largest metro areas, the typical rent for a new lease in September 2026 was lower than a year earlier, and in the other 33 it was higher, according to the Apartment List Rent Index.
The wave is now shrinking behind the scenes: fewer new homes are being started, and fewer are under construction than at the busiest point, in 2023. It is still arriving, though, and the first signs of a tighter market show up in the national numbers and in a handful of metro areas. This guide explains the delay built into construction, what to watch where you live, and how 43 large metro areas changed over the past year.
Why Do New Apartments Keep Opening After Construction Slows?
Because a building takes years to finish, and homes already under construction keep reaching the market after developers pull back on new projects.
Think of three stages: a city approves a project, crews break ground, and, months or years later, the building is finished and people can move in. Each stage is counted separately, and each peaked in a different year, according to Harvard's Joint Center for Housing Studies, drawing on Census Bureau data.
Apartment Construction by Stage: Peak Year and 2025
| Groundbreakings | About 550,000 in 2022, the most since the 1980s | 416,000 |
| Homes under construction | 996,000 in 2023 | 686,000 at year end |
| Finished homes | 608,000 in 2024, the most since 1986 | 488,000 |
Source: Harvard Joint Center for Housing Studies, America's Rental Housing 2026 (March 2026), drawing on Census Bureau data. National counts; each row is a separate annual total.
Each peak came a year after the one before: that is the delay, in numbers. The 2025 figures are still high by any earlier standard, and the homes under construction at the end of 2025 were more than double the roughly 300,000 finished in a typical year since 1990. So both things are true at once: construction is slowing, and new apartments keep opening.
What Should You Watch as the Wave Recedes?
Watch available apartments, days listed, move-in offers, and rent. They can change at different times, so read them together. Apartment List's economics team put it this way in its July 2026 review of the rental market: buildings tend to fill up before rents start rising, so a city can look like it is tightening before anything shows up in the rent.
Nationally, availability had been declining since February, while days listed were still longer and rent for a new lease still lower than a year earlier.
Where the National Measures Stood in September 2026
| Available apartments: share of units listed as available for rent in the established buildings Apartment List tracks | 7.0%, down from a 7.3% peak in February | 7.1% | Fewer than in February and slightly fewer than a year ago; still above the 6.4% typical from 2017 to 2019 |
| Days listed before leasing: median days on the market for the apartments that leased that month | About 34, the longest for any September since the data begin in 2019 | About 32 | Apartments still take longer to lease than a year ago |
| Rent for a new lease: Apartment List's estimated median | $1,388, down 0.1% from August after rising each month from February through August | $1,394 | Rents rose through spring and summer, dipped in September, and were $6 below a year earlier |
Source: Apartment List Vacancy Index, time-on-market data, and Rent Index, September 2026 data. The February peak, the 2017 to 2019 average, and the monthly rent path are as published in Apartment List's October 2026 National Rent Report. The buildings Apartment List tracks are mostly larger, professionally managed properties, so the availability share describes those buildings rather than every rental in the country.
The report also noted that the annual decline in rent narrowed for five straight months, from 1.6% in April to 0.4% in September.
Move-in deals are the fourth measure, and they are easy to misread on their own, because offers can stay common while availability is declining. Apartment List's August 2026 Nashville research found that in 2026 through July, more than 40% of Nashville apartment communities were offering at least one month of free rent, a larger share than a year earlier, even as it described the market as beginning to turn a corner.
Why Will the Answer Differ by City?
Because the wave landed unevenly, and it is receding unevenly too. Many metro areas still had more available apartments in September 2026 than a year earlier, and a handful had already tightened on both measures, including some where rents were still falling.
A metro area means the Census metro area, a city plus the suburbs and communities around it, so "Dallas" below covers Dallas, Fort Worth, Arlington, and their suburbs.
Comparing September 2026 with September 2025, the 43 large metro areas with both measures fall into three groups: 9 had fewer available apartments and faster leasing than a year earlier, 17 had more available apartments and slower leasing, and 17 were mixed, with the two measures pointing in different directions or one unchanged.
These groups describe change over the year. Apartment List's rankings of renter's markets and landlord's markets describe levels instead: in those rankings, a renter's market has more available apartments than the country as a whole, slower leasing, and rent flat or lower than a year earlier, and a landlord's market is the reverse on all three. The two readings can differ for the same metro. Austin led the renter's market ranking on August 2026 data and sits in the tightened group below, because its availability and days listed both fell over the year from a very loose starting point.
How to Read Your Area's Row
Every row has the same three parts, with last year's figure in parentheses. The first two, available apartments and days listed, describe competition among properties; the third is where rent for a new lease stood against a year earlier. Groups are assigned from the underlying values in Apartment List's data files, and the figures shown are rounded (to one decimal for availability, to the nearest day for days listed), so a row can show the same figure in both years and still count as a change; the commentary says so where it happens. All five tables draw on the Apartment List Vacancy Index, time-on-market data, and Rent Index, September 2026 data; the full note sits beneath the last table.
Fewer Available Apartments and Faster Leasing Than a Year Ago
More competition among renters than a year earlier.
Metro Areas That Tightened on Both Measures, September 2026 vs. September 2025
| Austin | 9.1% (9.8%) | 40 (40) | -2.1% |
| San Antonio | 8.8% (9.2%) | 37 (39) | -4.5% |
| Phoenix | 7.9% (8.4%) | 34 (36) | -2.2% |
| Tucson | 7.6% (8.4%) | 36 (45) | +0.3% |
| Jacksonville | 7.1% (7.3%) | 28 (30) | +0.2% |
| St. Louis | 6.3% (6.7%) | 30 (32) | +0.9% |
| San Jose | 3.9% (5.2%) | 27 (29) | +9.1% |
| Virginia Beach | 3.6% (5.1%) | 15 (20) | +7.7% |
| San Francisco | 3.3% (4.8%) | 23 (28) | +12.3% |
The bottom three rows, San Jose, Virginia Beach, and San Francisco, are the tightest markets shown anywhere on this page and have the fastest rent increases; they also held the top three places in Apartment List's landlord's market ranking on August 2026 data. Apartment List's August 2026 Bay Area research attributes the San Francisco and San Jose increases to demand from the growth of the AI industry meeting a region that did not take part in the supply wave.
The top six rows tightened from a much looser starting point: rent was within 1% of a year earlier in three of them and still falling in Austin, San Antonio, and Phoenix, and four of the six were renter's markets in the August 2026 ranking. Austin's days listed fell from 40.3 to 39.7, which both display as 40. Tightening from a loose starting point leaves a renter more room than the label suggests, but last year's discounts may be becoming less common, so compare the offers listings carry today.
More Available Apartments and Slower Leasing Than a Year Ago
More choice for renters than a year earlier.
Metro Areas That Loosened on Both Measures, With Availability Above the National 7.0%
| Charlotte | 9.2% (8.9%) | 38 (35) | -2.5% |
| Dallas | 8.8% (8.7%) | 38 (36) | -2.0% |
| Salt Lake City | 8.6% (8.5%) | 43 (37) | -1.6% |
| Tampa | 8.5% (7.3%) | 33 (31) | -2.2% |
| Las Vegas | 7.5% (6.9%) | 36 (32) | -3.0% |
| Indianapolis | 7.5% (6.6%) | 36 (26) | +0.4% |
| Louisville | 7.3% (6.4%) | 31 (25) | +0.1% |
| Minneapolis | 7.1% (7.0%) | 41 (37) | +1.9% |
These are the loosest markets shown, and they loosened further over the year. Charlotte had the largest share of available apartments of any large metro area with a September reading, and in five of the eight, rents were lower than a year earlier as well. Indianapolis, Louisville, and Minneapolis still had rents at or above a year earlier, a reminder that the first two columns describe competition among properties and the third can disagree with them.
Metro Areas That Loosened on Both Measures, With Availability At or Below the National 7.0%
| Miami | 6.5% (6.4%) | 30 (29) | +0.1% |
| Washington | 6.4% (6.4%) | 36 (32) | -0.6% |
| Columbus | 6.4% (5.9%) | 34 (29) | -0.3% |
| Cincinnati | 6.4% (5.5%) | 34 (28) | +0.3% |
| Boston | 6.3% (5.8%) | 35 (33) | +0.5% |
| Portland | 6.2% (6.0%) | 32 (31) | -1.1% |
| Chicago | 6.1% (5.4%) | 34 (31) | +3.0% |
| Seattle | 6.0% (5.9%) | 33 (30) | -1.1% |
| Tulsa | 5.4% (5.3%) | 29 (24) | +1.9% |
These nine areas loosened over the year from a tight starting point: the market getting a little easier rather than easy. Washington is here by a small margin, with availability up from 6.38% to 6.45%, so both years display as 6.4%. Four of the nine had rents slightly below a year earlier, none by more than 1.1%, and Chicago and Tulsa had the largest increases in the group even as more apartments were listed as available. In a loosening area, look for concessions and compare their total cost over the lease term, since a free month changes what you pay without changing the advertised rent.
Mixed Readings on Availability and Leasing Speed
The two measures pointed in different directions, or one was unchanged in the underlying data.
Metro Areas With Mixed Readings, With Availability Above the National 7.0%
| Houston | 8.4% (8.6%) | 36 (34) | -2.0% |
| Raleigh | 8.1% (8.1%) | 37 (34) | -0.8% |
| Denver | 8.0% (8.6%) | 37 (33) | -2.8% |
| Nashville | 7.8% (8.0%) | 35 (34) | -1.4% |
| Atlanta | 7.2% (7.5%) | 33 (30) | -0.2% |
| Orlando | 7.1% (7.4%) | 33 (30) | -1.9% |
All six had fewer available apartments than a year earlier, Raleigh by so little that both years display as 8.1%, while listings leased more slowly in every one and rents were lower than a year earlier in all six.
Metro Areas With Mixed Readings, With Availability At or Below the National 7.0%
| Kansas City | 6.8% (7.0%) | 35 (34) | +2.6% |
| San Diego | 6.1% (6.4%) | 30 (30) | +0.4% |
| Pittsburgh | 6.1% (6.4%) | 37 (35) | +1.5% |
| Hartford | 5.4% (4.0%) | 31 (33) | +1.8% |
| Baltimore | 5.3% (5.7%) | 28 (25) | +1.5% |
| Philadelphia | 5.3% (5.2%) | 34 (35) | +1.1% |
| Los Angeles | 5.2% (5.3%) | 30 (30) | -0.6% |
| Riverside | 5.1% (5.8%) | 25 (24) | +1.8% |
| New York | 5.0% (4.7%) | 31 (33) | +1.9% |
| Detroit | 4.5% (4.7%) | 23 (22) | +3.1% |
Source for all five tables: Apartment List Vacancy Index, time-on-market data, and Rent Index, September 2026 data. Metro areas with more than one million residents for which both availability and days-listed figures are published for September 2025 and September 2026 (43 of 55). Available apartments are the share of units listed as available for rent in the established buildings Apartment List tracks. Days listed are the median for apartments leased in the month, rounded to the nearest day. Rent is the typical rent for a new lease. Figures are rounded half up for display; groups are assigned from the underlying values. Within each group, areas are ordered by their September 2026 availability.
In this last table, the honest reading for most rows is "about the same as last year." Apart from Hartford, which had the largest rise in availability of any area shown, every other share here was within 0.7 of a point of last year's, and no area's days listed moved more than three; Los Angeles and Sacramento are here because their days listed were unchanged in the underlying data while availability edged down. In a mixed area, read both measures before assuming conditions broadly improved or worsened.
Two cautions when you read your own area's row. The groups compare one month with the same month a year earlier, and an area can move between groups from one month to the next. And the tables describe how hard properties are competing for renters, which is a different question from whether rents fit your budget.
Data month: The October 2026 National Rent Report, published September 29, 2026, covers September 2026 rental-market data. Research is cited by its publication date, which may differ from the dates of the data it analyzes.
Rent for a new lease: The Apartment List Rent Index (methodology) tracks rent changes for new leases using repeat rentals of the same units; Apartment List's estimated median rents apply that index to Census data. They do not describe renewal offers.
Available apartments: The Apartment List Vacancy Index (methodology) is the share of units listed as available for rent in the established buildings that list on Apartment List. Larger, professionally managed buildings are more likely to list, so the index describes availability in those buildings rather than a count of every available home. The index begins in January 2017; the 2017 to 2019 figure in the national table is the average of those 36 months.
Days listed before leasing: For each apartment leased in a month, Apartment List counts the days between listing and lease and reports the median across all apartments leased that month (methodology). The figures describe how long the apartments that leased had been listed; they do not measure how long any renter had to decide.
Construction: Groundbreakings, homes under construction, and finished homes are national counts of homes in buildings with multiple units, from Census Bureau construction data as reported by Harvard's Joint Center for Housing Studies. This guide carries no local construction figure.
Comparisons: September 2026 against September 2025 unless another period is named, in dollars, without adjusting for inflation. "Metro area" means the Census metro area, including the central city and surrounding communities.
What Does This Mean If You Are Searching or Renewing?
Whichever group your area is in, check current listings, the offers they carry, and when applications are due. The tables tell you how much competition to expect; the listings tell you what you can rent.
If you are searching in an area with more available apartments than a year ago, check what offers current listings carry. Compare the full cost of any offer over the lease term, and ask whether it repeats at renewal.
If you are searching in an area with fewer available apartments than a year ago, ask when an application is due. The days-listed figure describes how long the apartments that leased last month had been on the market, and says nothing about how long the one you want will stay available.
If you are renewing, none of these figures is your renewal offer: they describe what people pay when they move in, and a property can price a renewal differently. The most useful comparison is what similar apartments nearby are listed for right now.
Slower construction alone does not tell you when rents will rise in your area, or whether they will. Whether the buildings still opening fill quickly depends on how many people are looking for apartments, which changes with jobs, with people moving between cities, and with whether people live alone or together; Apartment List's economics team called that demand "the swing factor now" in its July 2026 review. For how the market reached this point, see How Has the Rental Market Changed Since 2019? A Renter's Guide.