Updated October 2026. Market snapshot: September 2026. Current market figures come from Apartment List's October 2026 National Rent Report. Historical comparisons use Apartment List data and research.
Rents surged in 2021 and into summer 2022 as demand for apartments rebounded from the pandemic's initial disruption in 2020. Then a wave of new apartments, with construction completions peaking in 2024, gave renters more options and helped bring prices down in many cities. By September 2026, those declines had reversed only part of the earlier increase, which is why rents can be falling and still feel expensive.
Apartment List's estimated national median rent, the midpoint with half of rents higher and half lower, was $1,388 in September 2026, 0.4% lower than a year earlier. Behind that figure are cities with very different histories: some metros have given back nearly all of their increase since 2020, and others are at their highest level since 2019. What the history means for you depends on where you live and whether you are apartment hunting or renewing a lease.
A Short Timeline of the Rental Market Since 2019
The pandemic changed both where people wanted to live and how many homes they needed. Apartment construction took years to respond. That mismatch drove the sharp rise in rents and the cooldown that followed.
What Changed in the Rental Market, 2019 to 2026
| 2019 | Steady rent growth with predictable seasonal swings. | Prices typically eased in fall and winter. |
| 2020 | The pandemic disrupted moves and shifted demand. | Some expensive cities got cheaper; other markets heated up. |
| 2021–2022 | Demand rebounded faster than apartments could be added. | Fewer options, faster leasing, and steep rent increases. |
| 2023–2025 | A wave of new apartments increased supply. | More choices, falling rents in many cities, and move-in deals. |
| 2026 through September | National rents remained slightly below a year earlier; local trends diverged. | More bargaining room in some cities, rising prices in others. |
Source: Apartment List Rent Index and the Apartment List research linked in the sections below. Construction figures are from Harvard's Joint Center for Housing Studies.
2020: People Changed Where and How They Lived
Early in the pandemic, some renters moved back in with family or combined households, while others left expensive cities or looked for more space. Apartment List's July 2022 household research estimated that more than 2.5 million households dissolved in early 2020, mostly young adults who had been living alone or with roommates and moved in with family, and that those households had re-formed by the end of the year.
The changes were uneven. According to the Apartment List Rent Index, the median rent in the city of San Francisco fell 26.2% during 2020, while in the city of Phoenix it rose 4.7%, as demand shifted from dense, expensive cities toward lower-cost cities and suburbs.
2021 and 2022: Demand Returned Faster Than Apartments Could Be Added
As people resumed living independently and new households formed, demand came back quickly. Buildings take years to plan and complete, so supply could not respond right away. The Apartment List Rent Index shows the national median rent rising 17.7% during 2021 and peaking at $1,442 in August 2022. For renters, the squeeze meant higher prices and fewer apartments to choose from.
2023 to 2025: New Buildings Helped Cool the Market
Projects planned during the 2021–2022 rent surge continued opening from 2023 through 2025, after demand had cooled. Apartment List's June 2024 construction research found that developers received permits for about 707,000 apartments in 2022, the most since 1985. A permit authorizes construction, and the apartment opens later, once the building is finished. Completions peaked well after permits did: in its America's Rental Housing 2026 report, the Harvard Joint Center for Housing Studies counted 608,000 multifamily homes completed in 2024, the most since 1986.
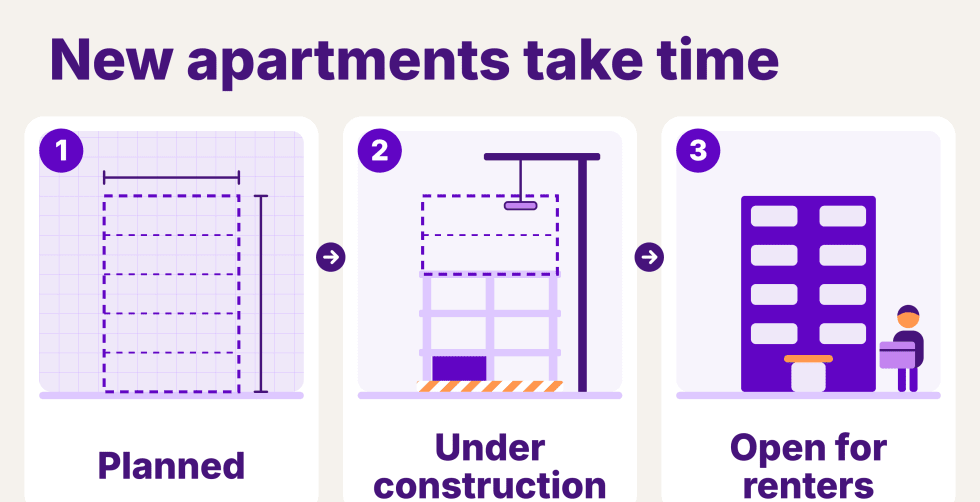
As those buildings opened, renters gained options, and properties competing to fill apartments had more reason to lower prices or offer a deal. The relief was uneven: the June 2024 research found the steepest rent declines concentrated in the metros that had permitted the most apartments, which helps explain why a national building boom reached some renters and skipped others.
Why Is Rent Still Expensive If Prices Have Fallen?
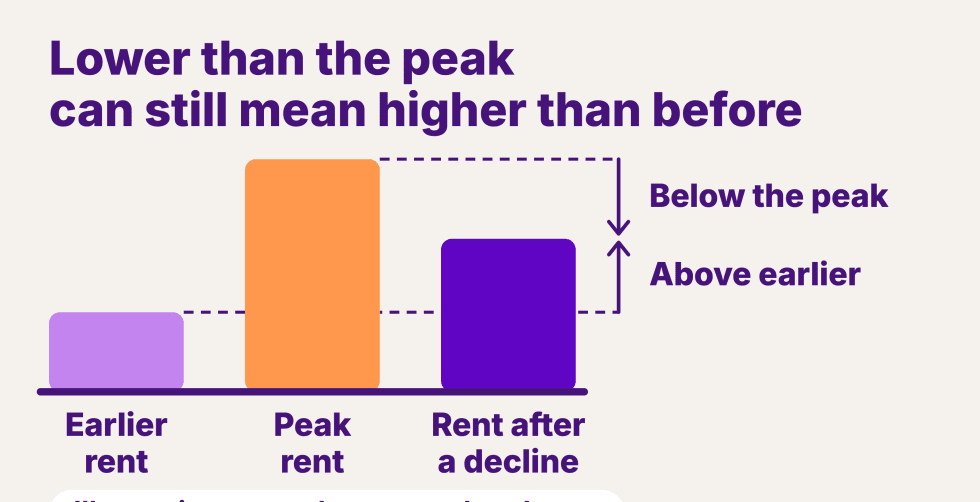
Recent declines have given back only part of the pandemic increase. A price can fall from its highest point and remain well above what you remember paying a few years ago.
Apartment List's estimated national median rent of $1,388 for September 2026 was:
| September 2025, one year earlier | 0.4% lower |
| August 2022, the national peak | 3.7% lower |
| March 2020, the start of the pandemic | 19.6% higher |
Source: Apartment List Rent Index, September 2026 data. Each row compares the same national estimate with a different starting date, in dollars, without adjusting for inflation or wages.
Two rows say down and one says up, and all three describe the same $1,388. "Down from the peak" describes relief from the most expensive point, while the comparison with March 2020 shows how much of the pandemic increase remains. Monthly and annual changes answer different questions too: a rent can rise for most of a year and still sit below the same month a year earlier, as the national median did in 2026. Comparing the same month across years looks past the usual seasonal pattern; comparing consecutive months shows what changed most recently.
Affordability also depends on income. In a February 2026 analysis of Census data, Apartment List found that 51.8% of renter households were cost-burdened in 2024, meaning they spent more than 30% of their monthly income on rent. A modest rent decline can help without making an apartment affordable on your budget.
Why Are Rents Falling in Some Cities and Rising in Others?
The national median hides how differently cities have moved. According to the Apartment List Rent Index, rents in September 2026 were below a year earlier in 22 of the 55 metros with more than a million residents and above a year earlier in the other 33, with declines concentrated in the South and Mountain West and increases across most of the Northeast, Midwest, and West Coast.
Even cities where rents are falling have very different price histories. The table measures six metro areas' median rent in September 2026 from three starting points.
Change in Metro Median Rent Through September 2026
| San Antonio | −4.5% | −13.9% (Aug. 2022) | +6.5% |
| Austin | −2.1% | −20.6% (Aug. 2022) | +2.5% |
| Tampa | −2.2% | −8.9% (Aug. 2022) | +30.7% |
| Minneapolis | +1.9% | −0.4% (Aug. 2026) | +12.1% |
| Chicago | +3.0% | −0.7% (July 2026) | +30.7% |
| San Francisco | +12.3% | At its high (Sept. 2026) | +12.9% |
| United States | −0.4% | −3.7% (Aug. 2022) | +19.6% |
Source: Apartment List Rent Index, September 2026 data. Rents are medians for new leases. All metro rows describe metro areas, including the central city and surrounding communities. The month in the peak column is when that area's rent was highest since 2019. A positive number means rent is higher than at that starting point.
Austin and Tampa show why two falling markets can feel so different. Both peaked in August 2022 and both were lower than a year earlier in September 2026, but Austin had given back nearly all of its increase since the pandemic began, with its median 2.5% above March 2020, while Tampa had retreated less and remained 30.7% above its starting point. How far rent climbed before the peak decides what "falling" leaves behind.
San Francisco shows what happens when demand rises in a market that built little. The metro's median was 12.3% higher than a year earlier, the largest increase among the 55 large metros, and at its highest level since 2019. Apartment List's August 2026 Bay Area research attributes the surge to demand from the growth of the AI industry meeting a housing market where very few new apartments have been built, the reverse of the pattern in the metros that built the most. The rows above are metro areas; the city of San Francisco on its own can read differently, so compare the same geography when you check your own market.
What Does a "Renter's Market" Actually Mean?
A renter's market means properties face more competition to attract tenants: more available apartments, listings that stay up longer, and move-in offers. The label describes competition among properties, so a market can be a renter's market while still being expensive for your income.
Apartment List's rankings of renter's markets and landlord's markets show where large metros stood on August 2026 data. Whichever list your metro is on, it can have more available apartments overall while apartments at your price point remain hard to find, so check the actual listings.
Why Are Some Apartments Offering Free Rent?
A free month of rent is one form of competition among properties. It helps a property fill apartments when listings take longer to lease, and it attracts renters while the advertised monthly rent stays the same.
What One Month Free Actually Saves
| Total rent over the lease | $16,500 |
| Average monthly cost, or net effective rent | $1,375 |
Figures exclude fees and utilities.
The average is what you save over the term; the payment schedule is a separate question. You might pay nothing in one month and $1,500 in the other eleven, or the property might spread the discount across the term. Before you sign, check the discount's conditions and ask whether the offer applies only to the initial lease, since a move-in discount can disappear at renewal even if the lease rent does not change. Our guide to saving money on rent covers how to weigh an offer against the full lease cost.
Does Slower Construction Mean Rents Will Rise Again?
Fewer new apartments can, over time, ease the competition among properties that pushed prices down. The change reaches renters slowly: buildings already under construction keep opening after developers cut back on new projects, so a slowdown today changes little about what is available this fall. Prices also depend on demand, which moves with jobs, migration, and household decisions, so the data cannot say when rents in your metro will rise, or by how much.
About the Data and Sources
Data month: The October 2026 National Rent Report, published September 29, 2026, covers September 2026 rental-market data. Research is cited by its publication date, which may differ from the dates of the data it analyzes.
Rent figures: The Apartment List Rent Index tracks rent changes for new leases using repeat rentals of the same units, and Apartment List's estimated median rents apply that index to Census data (methodology). They describe new leases and do not describe renewal offers.
Geography: "City" means the city itself; "metro area" means the Census metro area, which includes the central city and surrounding communities.
Comparisons: Percentage changes compare the stated month with the stated starting point, in dollars, without adjusting for inflation or wages. Other reports may measure advertised prices, different properties, or different areas, which is why two reports can show different numbers for the same month.
How to Use This History When You Search or Renew
Check the date and geography. Use the latest report for your city or metro, and compare it with the same area a year earlier.
Read "falling" with its starting point. Lower than last month, lower than last year, and lower than the 2022 peak are different claims.
Compare the full lease cost. Include required fees and any discounts, and check what you will owe each month.
Put a renewal beside real alternatives. Compare similar apartments before deciding whether to stay. Rate My Rent compares the rent you enter with what similar apartments nearby are listed for, and How to Negotiate a Lease Renewal for Your Apartment covers the conversation.
- Match size, condition, location, and amenities, and include moving costs. If you originally signed at a discount, an increase may still leave your rent below comparable listings.
Let your timing and available options guide the move. If your move date is flexible, you can compare seasonal prices and move-in offers across a few months. If you have a deadline, assess the apartments available now at your price point.
Six years of history explain why the market feels the way it does: a demand surge, a building boom that arrived late, and relief that reached some cities and skipped others. Your decision rests on two things the history cannot supply: what your current options cost, and how they fit your budget and timing. Check your metro's latest figures in the Apartment List National Rent Report, then browse available apartments to compare your options.
Frequently Asked Questions
Why Can My Renewal Rise When Market Rents Fall?
Apartment List's rent estimates describe new leases, while your renewal is an individual offer. The two can move differently. Compare your offer with similar apartments nearby, including fees and discounts.
Does One Month Free Lower What I Owe Each Month?
One month free lowers your total rent over the lease. Your monthly payment depends on whether the property spreads the discount across the term or applies it to one month. Check the payment schedule before signing.
Should I Wait for Rents to Fall Before Moving?
A falling national rent estimate cannot predict the price of the apartment you want. Base your decision on your deadline, budget, and current local listings. If your timing is flexible, compare seasonal prices and move-in offers.