The Ghost of Renters Past: A Portrait of Renters in the U.S. since 1930

The holiday season egg-cites us to reflect Santa-mentally on the past year and look forward to the new one. With 2017 coming to a wrap, the Apartment List Rentonomics team recently published our 2017 year in review, in which we dug into some of the major trends in the housing market in 2017 and made predictions for 2018. Now, we’re continuing to reflect on the past -- the ghost of renters past, you could say -- by looking at how the U.S. renter population has changed since 1930, when jazz star Duke Ellington and “Gone With the Wind” were pop culture hits.
Taking this long view provides an interesting perspective on how renting has changed over the past century.
1. Before 1950, renting was the norm
While the homeownership rate began to tick up in 2017, much has been made in recent years of its historically low level, with the 62.9 percent rate in the second quarter of 2016 being the lowest rate since 1965. In fact, the current homeownership rate is far above levels from the first half of the 20th century, when the U.S. was largely a renter society, with apartments soot-ing more Americans than in later years.
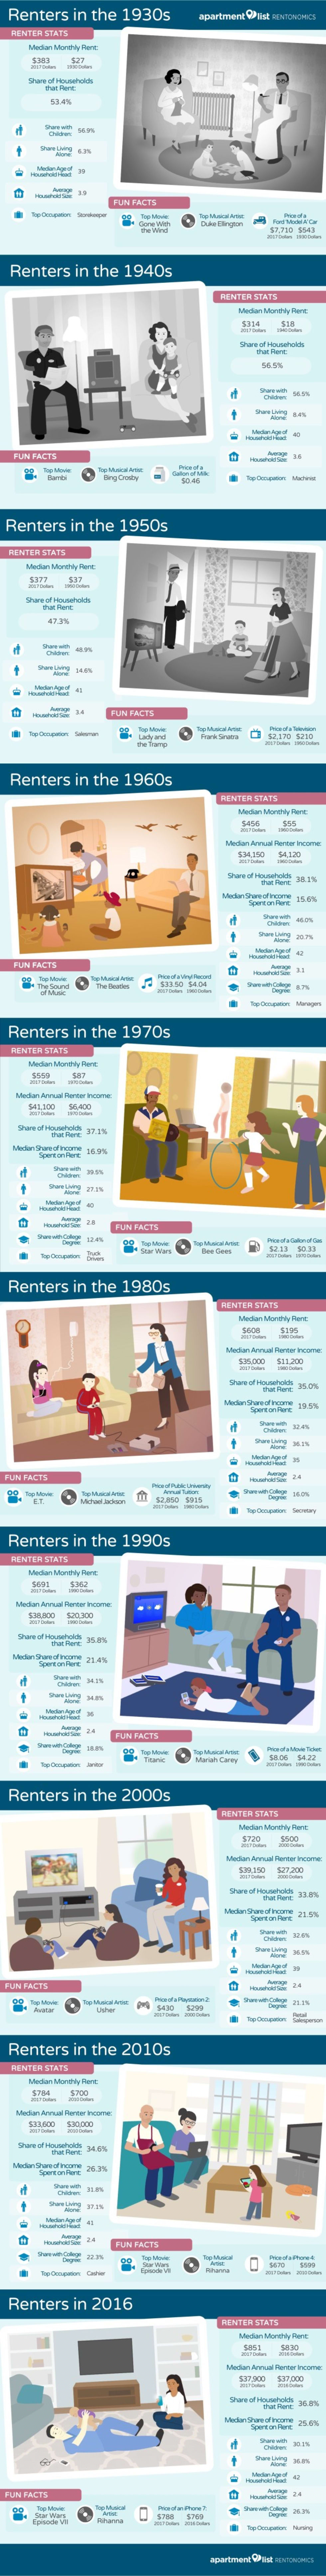
- In 1930, 53.4 percent of all households rented, and this share was relatively stable going back to 1900
- Renters made up a majority of U.S. households until after WWII, when an expansion of the mortgage industry, G.I. bill benefits and the growth of the suburbs combined to fuel an increase in homeownership
- In 2016, 36.8 percent of U.S. households were renter
2. Rents have been growing faster than renter incomes for decades
Examining historical data on median rents, we found that, while rents have grown significantly over the past half century, renter incomes have not kept pace.
- From 1930 to 1950, the median rent in 2017 dollars was below $400
- In the following decades, as Elf-is Presley rose to stardom and “Rebel Without a Clause” hit movie theaters, real median rents climbed steadily, reaching $851 in 2016
- From 1960 to 2016, the real median rent rose by 87 percent, while the real median renter income grew by only 11 percent
- The median share of income spent on rent increased from 15.6 percent in 1960 to 25.6 percent in 2016
3. Americans renters are living in smaller households, but larger homes
Analyzing data on the composition of renter households, we find a notable shift toward smaller households.
- In 1930, 56.9 percent of renter households included children under the age of 18, compared to 30.1 percent in 2016
- In 1930, only 6.3 percent of renters branched out to live alone, but, by 2016, this share rose to 36.8 percent
- The average renter household size has declined steadily from 3.9 people per home in 1930 to 2.4 people in 2016
- In 1960, the average rental unit contained 4.0 rooms, but by 2016 this figure grew to 4.4 rooms
Take a look at the images below for portraits of the typical renter households in each decade from 1930 through today. As your family reminisces over the holiday season, use these stats to fact-check grandpa on what it was like to be a renter back in his day, when the top jobs were often storekeepers and machinists.
And in the warmth of your home, wherever you may find yourself this holidays, may you have an oh-oh-oh so great holiday!
Methodology
All figures are calculated using Census data accessed from the IPUMS-USA database.1 Figures for 1930 to 2000 are based on data from the Decennial Census, while figures for 2010 and 2016 are based on data from the American Community Survey. Dollar values are inflation-adjusted to 2017 levels using Consumer Price Index estimates from Bureau of Labor Statistics.2 All calculations are performed at the household level.
Note that the data set for 1950 does not distinguish between owner and renter households. Numeric renter statistics listed for 1950 are imputed as a straight average of the values from 1940 and 1960. The “Top Occupation” for 1950 is chosen from the most common occupations across all households.
“Top Occupation” is selected from the top five most common occupations for renter households in the given year, so as to avoid repetition in the occupations listed. Occupation titles have been edited for concision and clarity. Complete data on the most common occupations in each decade is available upon request.
Median rent is calculated based on contract rent -- note that commonly cited statistics on the share of income spent on rent are generally based on gross rent including utilities costs, such that the shares listed here may be slightly lower than figures reported elsewhere.
Top musical artists for 1960 onward are the artists with the most Billboard number-one singles in the respective decade,3 while artists from earlier decades are chosen based on measures that may not be directly comparable across decades.4 Top movies are selected based on estimates of total domestic gross revenue by decade.5 Prices for various consumer goods are taken from various sources, which are available upon request.
- IPUMS-USA, University of Minnesota, www.ipums.org.↩
- https://data.bls.gov/cgi-bin/cpicalc.pl↩
- https://en.wikipedia.org/wiki/List\_of\_Billboard\_Hot\_100\_chart\_achievements\_by\_decade#Artists\_by\_total\_number-one\_singles↩
- http://tsort.info/music/faq\_decade\_artists.htm↩
- http://www.filmsite.org/boxoffice2.html↩
Share this Article
