Beyond the Headline Conversion Rate: How Multifamily Operators Should Measure AI Leasing Performance

AI leasing vendors often lead with a single headline conversion percentage. But multifamily operators do not judge leasing performance by the largest number in the funnel. They manage toward occupancy and leasing revenue, with tours and signed leases showing whether a property is on track.
As AI tools spread across ILSs and leasing systems, the useful question is where the improvement occurred, whether the results apply across all lead sources, and whether they continued into the outcomes owners and operators track.
The clearest evaluation gives greater weight to tours and leases, then asks whether the tool follows up with leads from every source and saves time for the onsite team. Applications remain important, but they should be read as one stage in a broader leasing performance story.
A complete AI leasing evaluation should answer five questions:
- Which conversion metrics deserve the most weight?
- Does improvement continue from applications into tours and leases?
- Does the tool follow up with leads from every source?
- How much time does it save onsite teams?
- Does the pricing model align spend with leasing performance?
AI Leasing Metrics Answer Different Business Questions
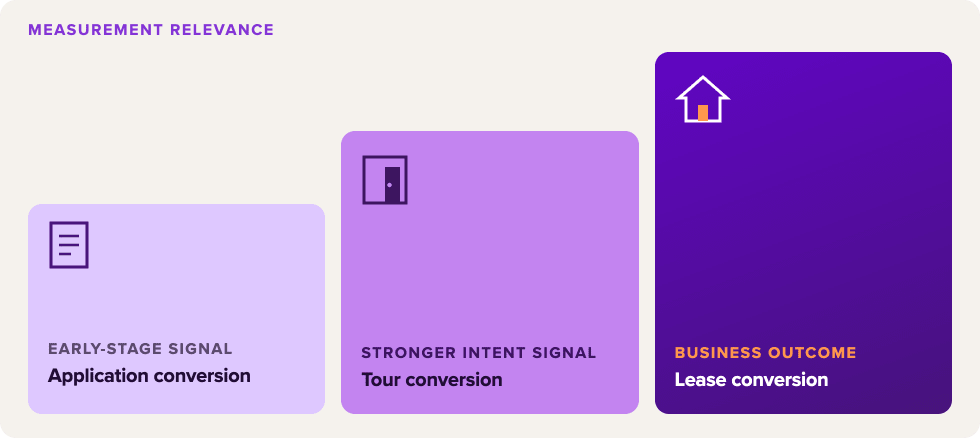
The closer a metric sits to occupancy and leasing revenue, the more directly it reflects operator priorities. Earlier signals still matter, but they should be used according to what they can tell you.
| Stage | What It Signals | How to Use It |
|---|---|---|
| Application | Renter has committed time and effort | Early indicator of intent; track whether the gain carries into later stages |
| Tour booked | Renter has scheduled a visit | Watch bookings and show rate to see if interest is becoming real leasing activity |
| Lease signed | Renter has completed the leasing decision | Weight this most; it's the closest tie to occupancy and revenue |
An application gain is worth having. A gain in tours booked or leases signed sits closer to occupancy and leasing revenue. The most useful evaluation asks whether progress at one stage continues into the next.
A-List Nurture Delivers More Tours, Higher Lease Conversion, and Time Back
A-List Nurture is Apartment List’s AI leasing assistant. It engages prospects 24/7 by email, phone, text, and chat, including when the leasing office is closed.
Across the platform, A-List Nurture delivers:
- 30% lead-to-tour conversion rate
- More than 40% additional tours booked
- 30% average higher lease conversion
- An average of 42 hours saved per property per week
Together, those figures show tour and lease performance alongside time saved onsite.
Consistent Follow-Up Across Lead Sources Improves Portfolio-Wide Leasing Performance
Prospects now discover communities through ILSs, property websites, paid and organic search, social media, referrals, and increasingly AI search and answer engines. They then inquire through website forms, phone calls, email, text, or chat. A tool limited to leads generated within one platform may improve performance there without changing how the property follows up with the rest of its prospects.
A-List Nurture follows up with leads from every source through one process. That creates several portfolio-level advantages:
- Consistent response across lead sources. Inquiries can receive the same attention regardless of origin.
- One follow-up process. Teams are not maintaining separate processes for every source.
- More value from existing marketing spend. The property can work more of the lead volume it already pays to generate.
- Broader portfolio impact. The product can follow up with prospects regardless of where the inquiry began.
This matters when comparing vendor results. A large improvement within one source may affect only a small share of total lead volume. Operators need to understand both the reported gain and the proportion of their leads to which it applies.
Application Conversion Is Most Useful Alongside Tour and Lease Results
Application conversion shows what share of a defined group completed an application. It indicates whether prospects are moving beyond initial engagement.
What it cannot do alone is describe the rest of the journey. Not every application results in a signed lease. That is why application conversion belongs in a lead-to-lease view rather than serving as a substitute for tour and lease performance.
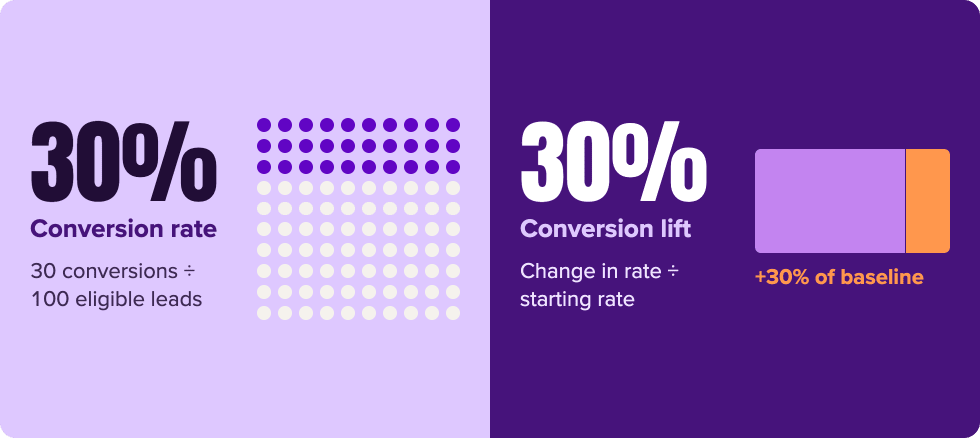
It is also important to distinguish a conversion rate from conversion lift. A conversion rate is the share of an eligible group that completes an action. A 30% lead-to-tour conversion rate means 30 out of every 100 eligible leads booked a tour.
Conversion lift describes improvement relative to a baseline. A 30% lift means the underlying rate increased by 30% from that starting point. A 30% rate and a 30% lift are different claims. Before comparing figures, confirm that they describe the same stage and measurement type.
When Leasing Metrics Diverge, Each Pattern Suggests a Different Next Step
Leasing metrics become more useful when they are read together. The relationship among applications, tour bookings, signed leases, and leasing cycle length can help an operator determine where to investigate next.
| If You See... | What It May Mean | What to Inspect |
|---|---|---|
| Applications rise, tours stay flat | Interest isn't reaching the tour stage | Qualification, availability, scheduling friction, follow-up time |
| Tours rise, leases stay flat | Bookings aren't yet reaching signed leases | Show rate, pricing, floorplan availability, screening, tour experience, post-tour follow-up |
| Lead-to-lease conversion rises without more leads | More leases from the same demand | Where efficiency improved and whether the gain repeats across properties |
| Lead-to-lease time drops, conversion holds | The same share converts in less time | Response time, touchpoints per lease, vacancy risk |
| Several stages rise together | The gain is carrying through the full funnel | Weight this more than an isolated conversion lift |
Thrive Communities Improved Response, Applications, Tours, and Leasing Speed
Thrive Communities, a Seattle-based operator, introduced A-List Nurture for after-hours lead follow-up across several communities. Their leasing team was already handling prospects effectively during office hours. The opportunity was responding to new inquiries and maintaining momentum after 5 p.m.
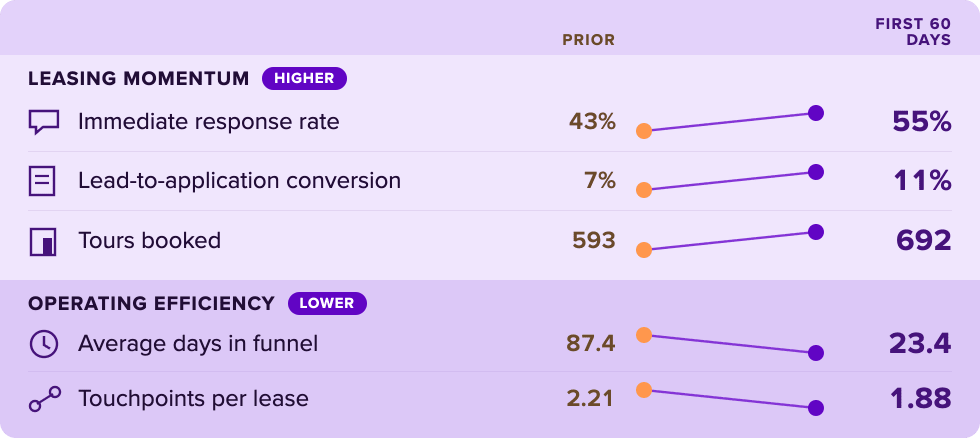
In the first 60 days:
- Immediate response rate increased from 43% to 55% of leads.
- Lead-to-application conversion increased from 7% to 11%.
- Tours booked increased from 593 to 692.
- Average time in the leasing funnel decreased from 87.4 days to 23.4.
- Touchpoints per lease decreased from 2.21 to 1.88.
The results moved together. More leads received an immediate response, application conversion increased, tour bookings grew, and the leasing cycle shortened by roughly two months. Thrive’s team also needed fewer touches per lease, reducing the manual follow-up required to keep prospects moving.
The application gain is more useful because it sits alongside additional tour bookings, a higher immediate response rate, fewer touches, and a shorter leasing cycle. Together, the results provide a more complete view than any one percentage.
“Our leasing teams are excellent at managing prospect demand during the day, but renter behavior doesn’t stop at 5 p.m. A-List Nurture gives us a way to engage prospects immediately and keep the leasing momentum going overnight,” said Jordan Restad, Senior Director of Marketing at Thrive Communities.
Five Questions to Ask When Comparing AI Leasing Results
Start with the results your properties and onsite teams already report:
- Which parts of the leasing process does it support? Determine whether the tool follows up from first inquiry through later stages and where the onsite team must take over.
- What happens at the next stages? Look beyond initial engagement to tour bookings and lease conversion. These results show whether the gain continues toward occupancy.
- Does it work across all lead sources? Identify whether the product can engage prospects across the property’s ILSs and inbound channels, not only the channel in which it is embedded.
- How much time does it save onsite teams? Translate hours saved into more time for follow-up, tours, closing, and resident service.
- How does pricing align with performance? Understand whether spend is tied to a leasing outcome or remains fixed when performance changes.
These questions provide a consistent framework for comparing products whose reported metrics may not be directly comparable.
Saving 42 Hours Gives Onsite Teams More Time for Tours, Follow-Up, and Residents
An average of 42 hours per property per week represents roughly one full-time workweek given back to the leasing office. It does not automatically translate into eliminating a position. It changes how the team can use its time.
After-hours inquiries do not have to become a Monday-morning backlog. Leasing professionals can spend more time with complex or high-intent prospects, conduct tours, support residents, and handle day-to-day property operations. For lean onsite teams, those saved hours can also provide more consistent coverage without stretching staff across hours they cannot reasonably support.
The pricing model should follow the same logic. Apartment List’s pay-per-lease model ties spend to signed leases, so cost tracks leasing performance.
Operators can run their portfolio through the A-List Nurture Savings Calculator to estimate the payroll value of the hours saved across their communities.
Evaluate AI Leasing Tools Against Your Own Lead-to-Lease Performance
The next AI leasing decision should start with the metrics an operator already tracks. Pull application conversion, tour bookings, lease conversion, immediate response rate, and the hours the onsite team spends on follow-up. Then ask each vendor where its gains appear, whether it works across all lead sources, and how much follow-up it handles for the onsite team.
A-List Nurture offers a clear benchmark across those dimensions: more tours booked, higher lease conversion, engagement across every lead source, and an average of 42 hours saved per property each week.
Explore A-List Nurture and compare its lead-to-lease results with the metrics your portfolio already tracks.
Share this Article