Where are millennials moving to?

Millennials form the largest generation in the US, numbering more than 75 million nationwide. As this young, mobile group enters the workforce and forms new households, their decisions have a significant impact on the cities they choose to live in. Today, we look at Census data from 2005-2015, to understand where young Americans are moving to and choosing to settle down.
Surprisingly, metropolitan areas on the interior saw the biggest increases in millennial population. Among 50 large metropolitan areas, Charlotte, Houston, and Austin saw the most growth. 7 out of the top 10 large metros for millennial population growth were located away from the coasts. The biggest declines, however, happened in the Midwest and South - Detroit, Miami, and Phoenix, for example. These movements appear to be correlated with income growth in these cities.
Homeownership, on the other hand, appears to be driven by a combination of wage growth and affordable housing. Some of the smallest decreases in the homeownership rate were seen in Oklahoma City, Omaha, Seattle, and Pittsburgh. The biggest decreases occurred in metropolitan areas that had poor wage growth (Atlanta, Las Vegas, Indianapolis) or were unaffordable (Tampa and Washington DC).
Metropolitan areas on the interior saw the biggest increases in millennial population
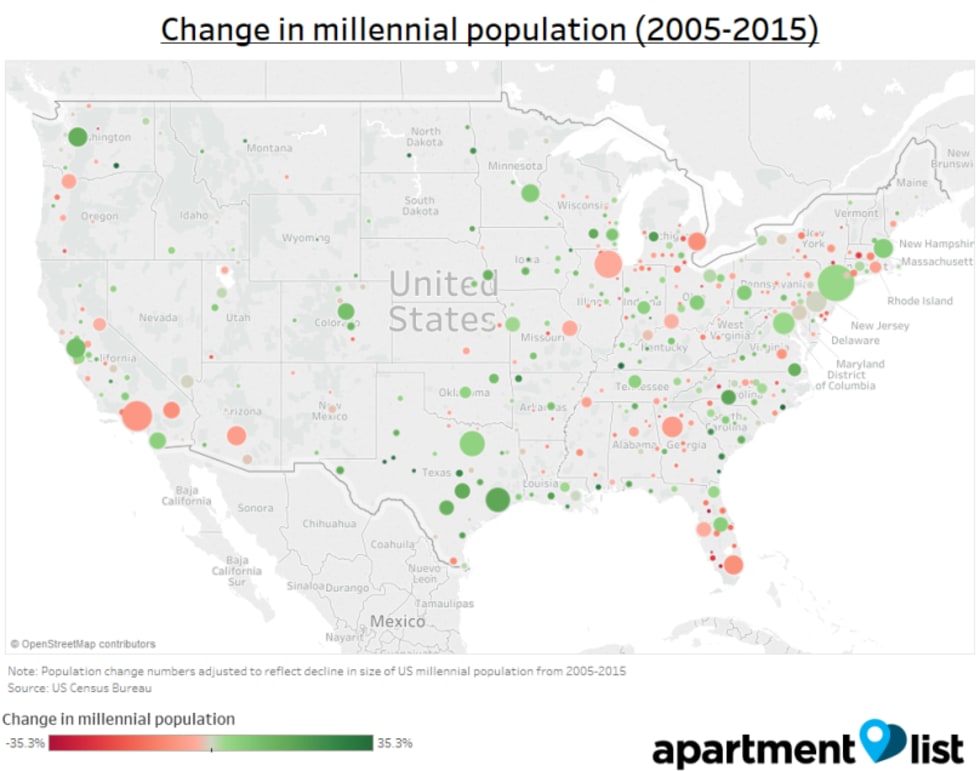
We began by analyzing Census data to determine which metropolitan areas saw the biggest changes in adults aged 18-35 over the past decade, adjusting for the change in young adult population nationwide.
Many have suggested that millennials favor walkable cities that provide easy access to amenities and recreation (San Francisco or DC, for example), but the metropolitan areas with the fastest growth tended to be on the interior. Charlotte, Houston and Austin, for example, all had increases of more than 15%. Looking at the top 50 metros, 7 of the 10 fastest growing were on the interior; the only coastal cities to crack the top ten were Seattle, Virginia Beach and San Francisco.
The biggest declines, however, tended to happen on the South and Midwest. Detroit, Miami, Richmond, Atlanta, and Phoenix all saw millennial population declines of 6% or more. Millennials also left Memphis (-5.6%), Chicago (-3.5%) and Cincinnati (-2.9%).
These shifts led to some metropolitan areas becoming significantly more popular for millennials. Charlotte, for example, was previously the 31st most attractive city, but rose 9 spots to 22nd. On the flip side, Detroit fell from 11th to 15th, and Cincinnati fell from 23rd to 30th.
Millennial population increases driven by strong wage growth
Apartment List's renter surveys consistently show that local career opportunities are one of the most important factors to millennials, and we had a hunch that strong job markets might explain some of these population trends. To confirm this hypothesis, we looked at changes in inflation-adjusted median income for each metro, and compared it to population growth.

Unsurprisingly, millennials are attracted by strong job markets. Houston, Austin, and Seattle, metros that saw significant millennial population growth, also had significant income growth. Detroit, Riverside, and Atlanta, on the other hand, actually saw inflation-adjusted incomes decline, and millennials moved away as a result. The one exception is Charlotte, where population boomed even as incomes declined, but recent data suggests that incomes there are growing strongly as well.
Homeownership driven by both affordability and wage growth
Population trends tell us where millennials are moving to - an important indicator for cities planning for the future - but homeownership rates demonstrate where millennials are settling down. To understand this, we analyzed Census data on the millennial homeownership rate by metro, comparing 2005 to 2015.

The millennial homeownership rate fell by 7% nationwide (from 39% to 32%), but there is significant variation across metros. The above chart shows the homeownership rate in 2005 (top of the bar) compared to 2015 (bottom of the bar), with the bar size being the magnitude of the drop.
Unsurprisingly, affordable metros on the interior (especially in the Midwest) have higher homeownership rates, while SF, San Jose, NYC, San Diego, and LA have rates that are ~10% lower than the national average. Chicago, however, used to have one of the highest millennial homeownership rates (45% in 2005, vs a national average of 39%), but is now right at the national average (32%). Las Vegas and Tampa, on the other hand, used to be close to the national average, but now trail significantly behind.

The table above shows the metros with the biggest declines in the millennial homeownership rate. Metros in the South and Midwest - especially those with poor income growth - saw large drops. Notably, expensive metros like San Francisco and San Jose still saw significant declines in homeownership rates, even with strong job markets.

On the other hand, metros with the smallest decreases in homeownership rate tended to have rising wages and affordable housing (Omaha, Oklahoma City, and Pittsburgh being good examples).
What happens if these trends continue?
San Francisco, Seattle, and Denver tend to dominate discussions about where millennials are moving to. Further examination, however, reveals that there are other metros that are attractive as well, especially in Texas - Houston, San Antonio, and Austin all ranked very well.
Our analysis does suggest some worrying trends for certain metros in the Midwest and South, which are losing millennials and experiencing declining homeownership rates. More recent data suggests that some of these trends may correct themselves in time (Detroit, for example, actually grew in population by 6% from 2014 - 2015), but city planners and policymakers in those areas may want to pay close attention to these trends. In doing so, they would do well to remember that - despite popular stereotypes about millennials wanting urban lifestyles and amenities - good jobs and strong wage growth remain a key deciding factor for millennials across the country.
Notes on methodology
Correction (11/21/16): An earlier version of this analysis contained a mistake with regards to how we handled changes in Census MSA boundaries. This error has now been corrected, and all figures included above have been revised accordingly; the update does not change the overall conclusions of the study, but some of the individual metro figures and rankings have shifted around.
This analysis is based on data obtained from the Census Bureau tracking owner and renter populations by metro. We classify millennials as adults in the age group 18-34; we look at the population aged 18-34 in each year of the study, rather than tracking a single cohort over time. Data is measured at the household level; i.e. we track millennial heads-of-household, rather than total millennial population.
In some cases, the Census changed metropolitan area (MSA) definitions during this time period - specifically, in 2013, some metropolitan area boundaries were changed to account for new information from the 2010 decennial Census. We control for changes in MSA boundaries is by dropping the data in the year of the change and imputing the population growth in that year as the average growth across all other years for the given MSA (e.g. additional counties were added to the Charlotte MSA in 2013; therefore, the population jump from 2012-2013 does not represent true population growth, so we adjust up the figures for 2005-2012 to control for this).
We also adjusted population numbers for every metro to account for the overall change in millennial population in the US. This means that the population change numbers are relative to the US as a whole.
To calculate homeownership rates for adults aged 18-34, we performed the same adjustment for renters and owners in each metropolitan area, then used those numbers to calculate the homeownership rate. We did not perform any adjustment for median income numbers, as those numbers did not seem to be meaningfully affected by changes in metropolitan area definitions.
Share this Article