September 2017 Rent Report

Methodology Updates
Apartment List is committed to making our rent estimates the best and most accurate available, and as part of our efforts toward that goal, we've recently made some changes to our methodology. Data from private listing sites, including our own, tends to skew towards luxury apartments, introducing sample bias.
In order to address these limitations, our estimates now start with reliable median rent statistics from the Census Bureau, which we then extrapolate forward to the current month using a growth rate calculated from our listing data. In calculating that growth rate, we use a same-unit analysis similar to Case-Shiller’s approach, comparing only units that are available across both time periods to provide an accurate picture of rent growth in cities across the country.
We are continuously working to improve our methodology and data, with the goal of providing renters with the information that they need to make the best decisions. You can read more about our new methodology here.
Welcome to the September 2017 National Apartment List Rent Report! Rents continued to increase this month, but at a lower rate than we've seen recently, with our national index up 0.2% month-over-month.
Read on for an analysis of the trends we're seeing this month:
National index up 0.2% month-over-month
Our national rent index has increased every month this year, with year-over-year growth currently falling in between the levels from the two prior years. Rents grew at a rate of 0.2% between July and August, which is the smallest month-over-month increase we've seen since January.

Year-over-year growth at the national level currently stands at 3.0%, trending well ahead of the 2.1% rate from this time last year, but still lagging a bit behind the 3.5% growth experienced in 2015. Rents have been rising steadily since January, with an average month-over-month increase of 0.4% over the course of this year. Year-over-year rent growth is now pacing well ahead of the overall rate of inflation, which stands at 1.7% as of the latest data release.
Our national rent index began its upswing early this year. In particular, we saw large month-over-month increases of 0.6% in March and 0.7% in April, whereas rent growth in the spring months was much flatter in previous years. That momentum has continued through the summer months, with seasonal increases in rental activity driving up prices.
However, rent growth may be leveling off -- this month's increase of 0.2% is the smallest we've seen since January. Based on seasonal trends, the fall and winter months generally experience slower rent growth, so this month's flattening may signal the beginning of the renting off-season. On the other hand, there is currently a severe shortage of entry-level homes for sale, a trend which may sideline many potential first-time buyers and create additional demand for rentals.
Rents down month-over-month in 23 of 100 largest cities
The trend of flattening rents at the national level is being mirrored in some of the nations biggest markets -- the map below show's month-over-month rent growth for the nation's 100 largest cities (markers are sized by population):
Note that rents declined month-over-month in 23 of the nation's 100 largest cities, whereas last month only 16 cities saw rents fall. Similarly, only 19 cities saw rents increase by more than 0.5% over the past month, compared to 47 cities that crossed that threshold last month. Despite the slowdown, rents are still up year-over-year in 92 of the 100 largest cities, which is the same number as last month. The chart below shows how rents have changed over the past year for the five cities that experienced the fastest growth:

Sacramento overtook Arlington, TX this month for the nation's fastest rent growth, with an increase of 9.4% over the past year. Each of the cities in the above chart have experienced sharp rent hikes of around 7% or higher in the past 12 months.
At the state level, Washington experienced the fastest year-over-year growth in the nation at 5.4% - Vancouver, WA saw rents increase by 6.8%, while prices were up by 6.6% in Tacoma and 5.4% in Seattle.
Rents declining in Houston and Washington, DC
Only 8 of the 100 largest cities have seen rents fall over the past year, but an additional 25 saw modest gains of less than 2%. The chart below shows trends for the five cities where rents declined most:
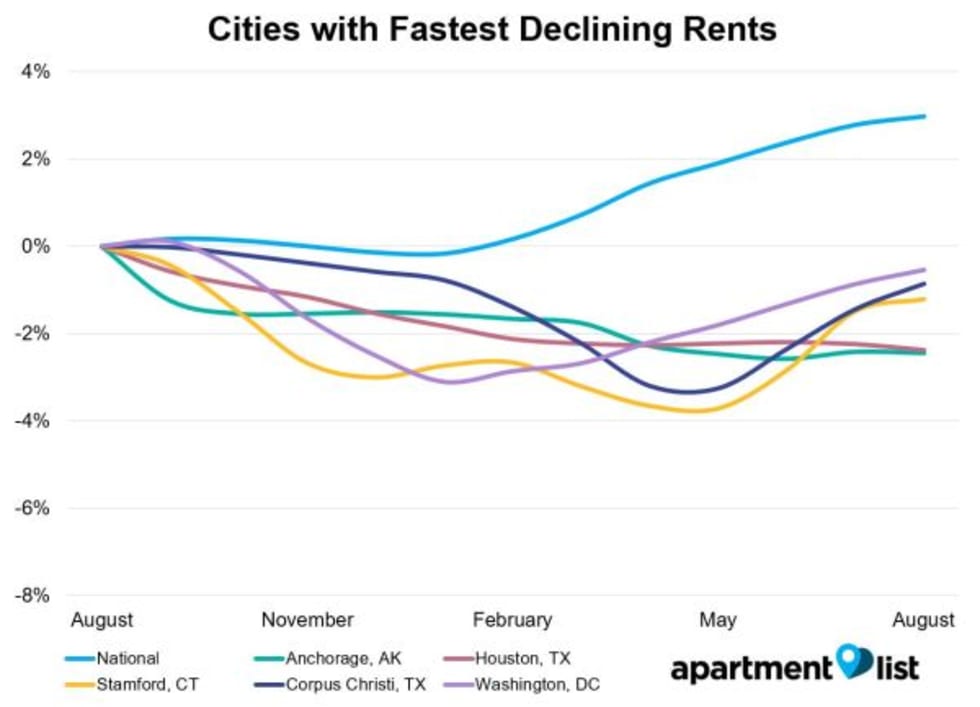
Anchorage continues to top this list, with rents declining by 2.4% over the past year; the median 2-bedroom there now goes for $1,090. Houston is the largest city in the country to see rents decline, with prices there down 2.6% year-over-year; rents have also fallen by 0.9% in Corpus Christi, the other major city on the Texas Gulf Coast.
The other major market on this list is Washington, DC , where rents have decreased by 0.5% over the past year. This trend is affecting the entire DC metro -- of the ten largest cities in that metro, three have experienced falling rents over the past year, and none have seen growth above 3%.
Please see additional data below for the nation's 100 largest cities, or check out the full data for your city or county at our rental data page. And as always, feel free to contact us with any questions!
| City Name | Median 1 BR price | Median 2 BR price | M/M price change | Y/Y price change |
|---|---|---|---|---|
| New York, NY | $2,090 | $2,490 | 0.3% | 1.1% |
| Los Angeles, CA | $1,350 | $1,740 | 0.5% | 5.0% |
| Chicago, IL | $1,100 | $1,290 | -0.2% | 3.8% |
| Houston, TX | $810 | $990 | -0.1% | -2.4% |
| Philadelphia, PA | $970 | $1,170 | 0.2% | 1.9% |
| Phoenix, AZ | $820 | $1,020 | 0.2% | 4.9% |
| San Antonio, TX | $840 | $1,060 | 0.2% | 2.8% |
| San Diego, CA | $1,560 | $2,020 | 0.6% | 4.6% |
| Dallas, TX | $890 | $1,110 | 0.2% | 2.8% |
| San Jose, CA | $2,060 | $2,580 | 0.1% | 2.2% |
Check out our rent reports for the following cities:
- Atlanta, GA
- Austin, TX
- Baltimore, MD
- Boston, MA
- Boulder, CO
- Charlotte, NC
- Chicago, IL
- Cleveland, OH
- Colorado Springs, CO
- Dallas, TX
- Denver, CO
- Detroit, MI
- Fort Collins, CO
- Fort Lauderdale, FL
- Houston, TX
- Indianapolis, IN
- Jacksonville, FL
- Los Angeles, CA
- Miami, FL
- Minneapolis, MN
- New York, NY
- Orlando, FL
- Phoenix, AZ
- Raleigh, NC
- San Antonio, TX
- San Diego, CA
- San Francisco, CA
- San Jose, CA
- Seattle, WA
- Tallahassee, FL
- Tampa, FL
- Tucson, AZ
- Washington, DC
If you would like to get future updates from Apartment List Rentonomics, please subscribe to our email list.
Methodology:
Apartment List Rent Report data is drawn monthly from the millions of listings on our site. 1-bedroom and 2-bedroom rents are calculated as the median for units available in the specified size and time period. Price changes are calculated using a “same unit” methodology similar to the Case-Shiller “repeat sales” home prices methodology, taking the average price change for units available across both time periods. For top city rankings, we calculated median 1-bedroom and 2-bedroom rents in 100 top cities and then ranked them by 2-bedroom rents.
About Apartment List Rent Reports:
Apartment List’s Rent Reports cover rental pricing data in major cities, their suburbs, and their neighborhoods. We provide valuable leading indicators of rental price trends, highlight data on top cities, and identify the key facts renters should know. As always, our goal is to provide price transparency to America’s 105 million renters to help them make the best possible decisions in choosing a place to call home. Apartment List publishes Rent Reports during the first calendar week of each month.
Share this Article