A Day in the Life: How Renters and Homeowners Spend Their Time

Introduction
Time is our most valuable resource, and the way that we choose to spend our hours ultimately adds up to the way that we spend our lives. Those choices are significantly impacted by the places we call home. Where one lives determines the length of one’s commute, and most of us spend the bulk of our time in locations close to home.
That said, where we live impacts how we spend our time in ways that go beyond location. Whether one owns or rents one’s home also plays an important role. Homeowners bear a greater responsibility than renters for maintaining their homes, and the time that this requires can be substantial. In order to better quantify the differences in how homeowners and renters spend their days, we dug into data from the American Time Use Survey, which collects detailed data on every activity that respondents engage in over the course of a day.
A day in the life
To see what a “typical renter’s day” looks like, we broke down respondents’ activities into broad categories and calculated the average amount of time spent on each:1
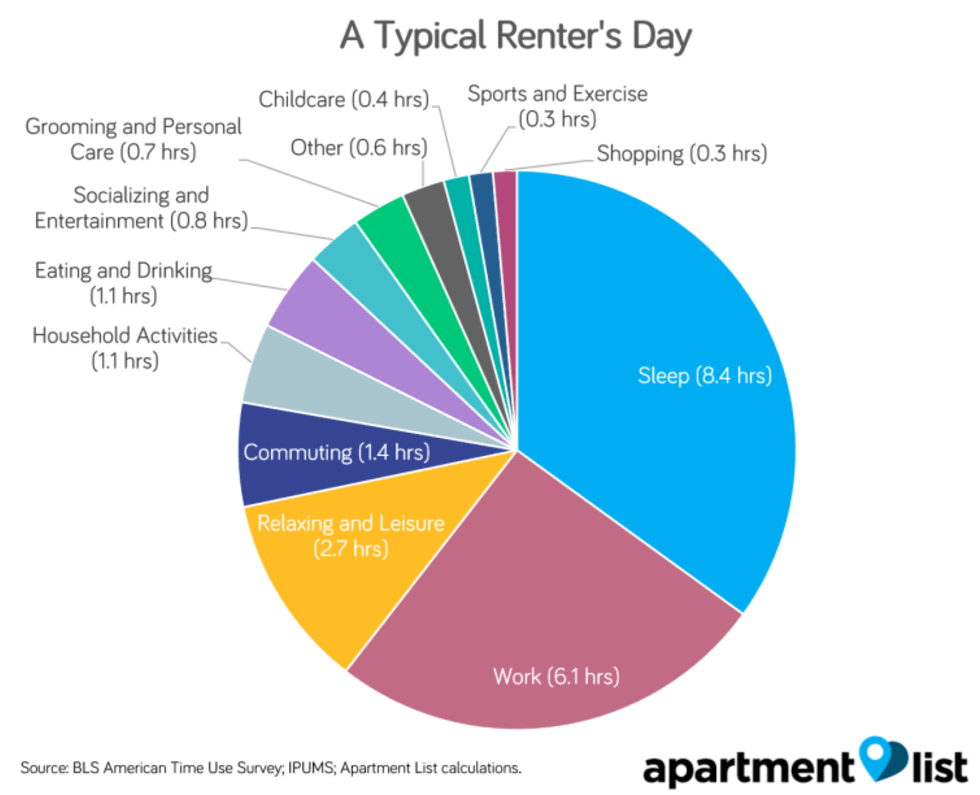
Sleep and work are two things that are required of most all adults, so it’s perhaps unsurprising that renters spend nearly two-thirds of a typical day on these activities. The average renter sleeps a healthy 8.4 hours per night and works 43 hours per week.2
After work and sleep, the following categories take up the largest shares of the remaining day:
- Relaxing and Leisure (2.7 hours): Within this category, watching TV is the single most popular activity, accounting for 71% of leisure time, or 1.9 hours per day, while the remaining 47 minutes of leisure are spent on hobbies and other activities.
- Commuting (1.4 hours):3 This fairly substantial commute time may be surprising given the common perception that renters value central locations, but we’ve found that as affordability continues to be an issue, many renters are dealing with lengthening commutes.
- Household Activities (67 minutes): This category includes chores and maintenance around the house, with food prep and housework accounting for 67% of this time.
- Eating and Drinking (66 minutes): Averaged across breakfast, lunch, and dinner, this would amount to a fairly rushed 22 minutes per meal.
- Socializing and Entertainment (46 minutes): Notably, this category -- which includes activities like spending time with friends or going to the movies or a museum -- takes up less than one-third the time that’s devoted to the more solitary relaxing and leisure category above.
After all the time spent on the categories of activities described above, just 2.4 hours of the day are left. Of that remaining time, renters spend, on average, only 20 minutes per day on sports and exercise, which is equal to the amount of time they spend shopping. Perhaps some apartment complexes should consider converting their on-site fitness facilities into retail storefronts.
With fewer household obligations, renters have more time for themselves
Next, we compared the typical day of a renter to that of a homeowner. There are many similarities -- renters and homeowners alike all need to eat, sleep and work -- but there are also notable differences in how the two groups spend the time between these common activities. The following chart shows the difference between owners and renters in the average amount of time per day spent on the major categories of activities:
The biggest gap between renters and homeowners is in the household activities category, with renters spending an average of 23 fewer minutes per day on these tasks. While this may not seem like a huge amount of time, it adds up to 141 hours over the course of a year. In other words, homeowners spend the equivalent of three and a half additional 40-hour work weeks per year taking care of their homes.
This time savings is likely attributable to the fact that for most renters, general upkeep of the property is the responsibility of their landlord, whereas homeowners bear this burden directly. Drilling down into common tasks within the household activities category, we find that the biggest gaps are in:
- Lawn and Yard Care (renters save 56 minutes per week): Many renters don’t have their own yards, and even for those who do, the landlord often takes care of these tasks.
- Maintenance and Repairs (renters save 32 minutes per week): Again, landlords generally handle such issues for renters.
- Housework (renters save 23 minutes per week): This may be due to the fact that rental units tend to be smaller than owner-occupied ones, and therefore faster to clean.
- Food Prep (renters save 21 minutes per week): It’s unclear here if renters are more likely to eat out, if they’re preparing simpler meals, or if they just have better knife skills.
Importantly, demographic differences between owners and renters don’t account for these differences. In a regression analysis controlling for age, sex, race, income, marital status, and the presence of children in the household, we still found a statistically significant impact, with renters spending 14 fewer minutes per day on household activities in our model.4
After household activities, the category where renters have the second biggest time advantage is in caring for household members, which accounts for 16 fewer minutes in the average renter’s day. This difference is largely due to the demographic fact that renters are less likely to have children. That said, a more muted trend persists even when controlling for this fact. When limiting our sample to just households with children, renters still spend 7 fewer minutes per day on caring for household members, and our regression analysis found a similar yet slightly smaller gap of 5 minutes.
So what do renters do with the time they’re saving on these activities?
- Sleep (renters get 14 extra minutes per day): This is the category where renters spend the most additional time in comparison to homeowners.5 Over the course of a year, renters get an extra 84 hours of sleep -- more than 10 full nights of getting the recommended 8 hours.
- Relaxing and Leisure (renters get an extra 12 minutes per day): Enough time for nearly 4 extra Office episodes per week! But less than two episodes if you’re more into Game of Thrones...
- Socializing and Entertainment (renters get an extra 5 minutes per day):6 Some days, a quick chat with a friend can make all the difference.
In addition to differences in how renters and homeowners spend their time, we also found a difference in where they spend it. The typical renter spends an average of 25 fewer minutes per day in his or her home.
Conclusion
In today’s frenzied world, most of us are familiar with the feeling that there aren’t enough minutes in the day. The time that we’re able to carve out for ourselves is precious, and it’s worth exploring ways that we can add to it. While the decision to rent or own one’s home is often thought of as a financial consideration, owning a home also involves salient time commitments which are often overlooked.
We find that compared to homeowners, renters spend notably less time taking care of their homes, leaving them with more time to spend on themselves and their friends. For those who may be on the fence about whether owning or renting is a better choice, this lifestyle benefit of renting is one that should not be discounted.
- Here and throughout, our sample is limited to prime working age adults, age 25 to 54, who are employed full-time with a household income of at least $50k. This restricted sample consists of over 12k responses gathered from 2013 through 2017.↩
- Our “typical day” is averaged across both working and non-working days, such that work accounts for 6.1 hours in the chart above (6.1 hrs per day = 42.9 hrs per week / 7 days).↩
- Includes all commuting time, to work as well as other locations.↩
- Details on model specification and full regression results are available upon request.↩
- In our regression analysis, this effect was somewhat more muted, with a difference of 4 minutes between owners and renters.↩
- In our regression analysis, this category and the prior were combined into “socializing, relaxing, and leisure”, with our model estimating a gap of 6 minutes between owners and renters.↩
Share this Article
